MAAP #109: Fires and Deforestation in the Brazilian Amazon, 2019


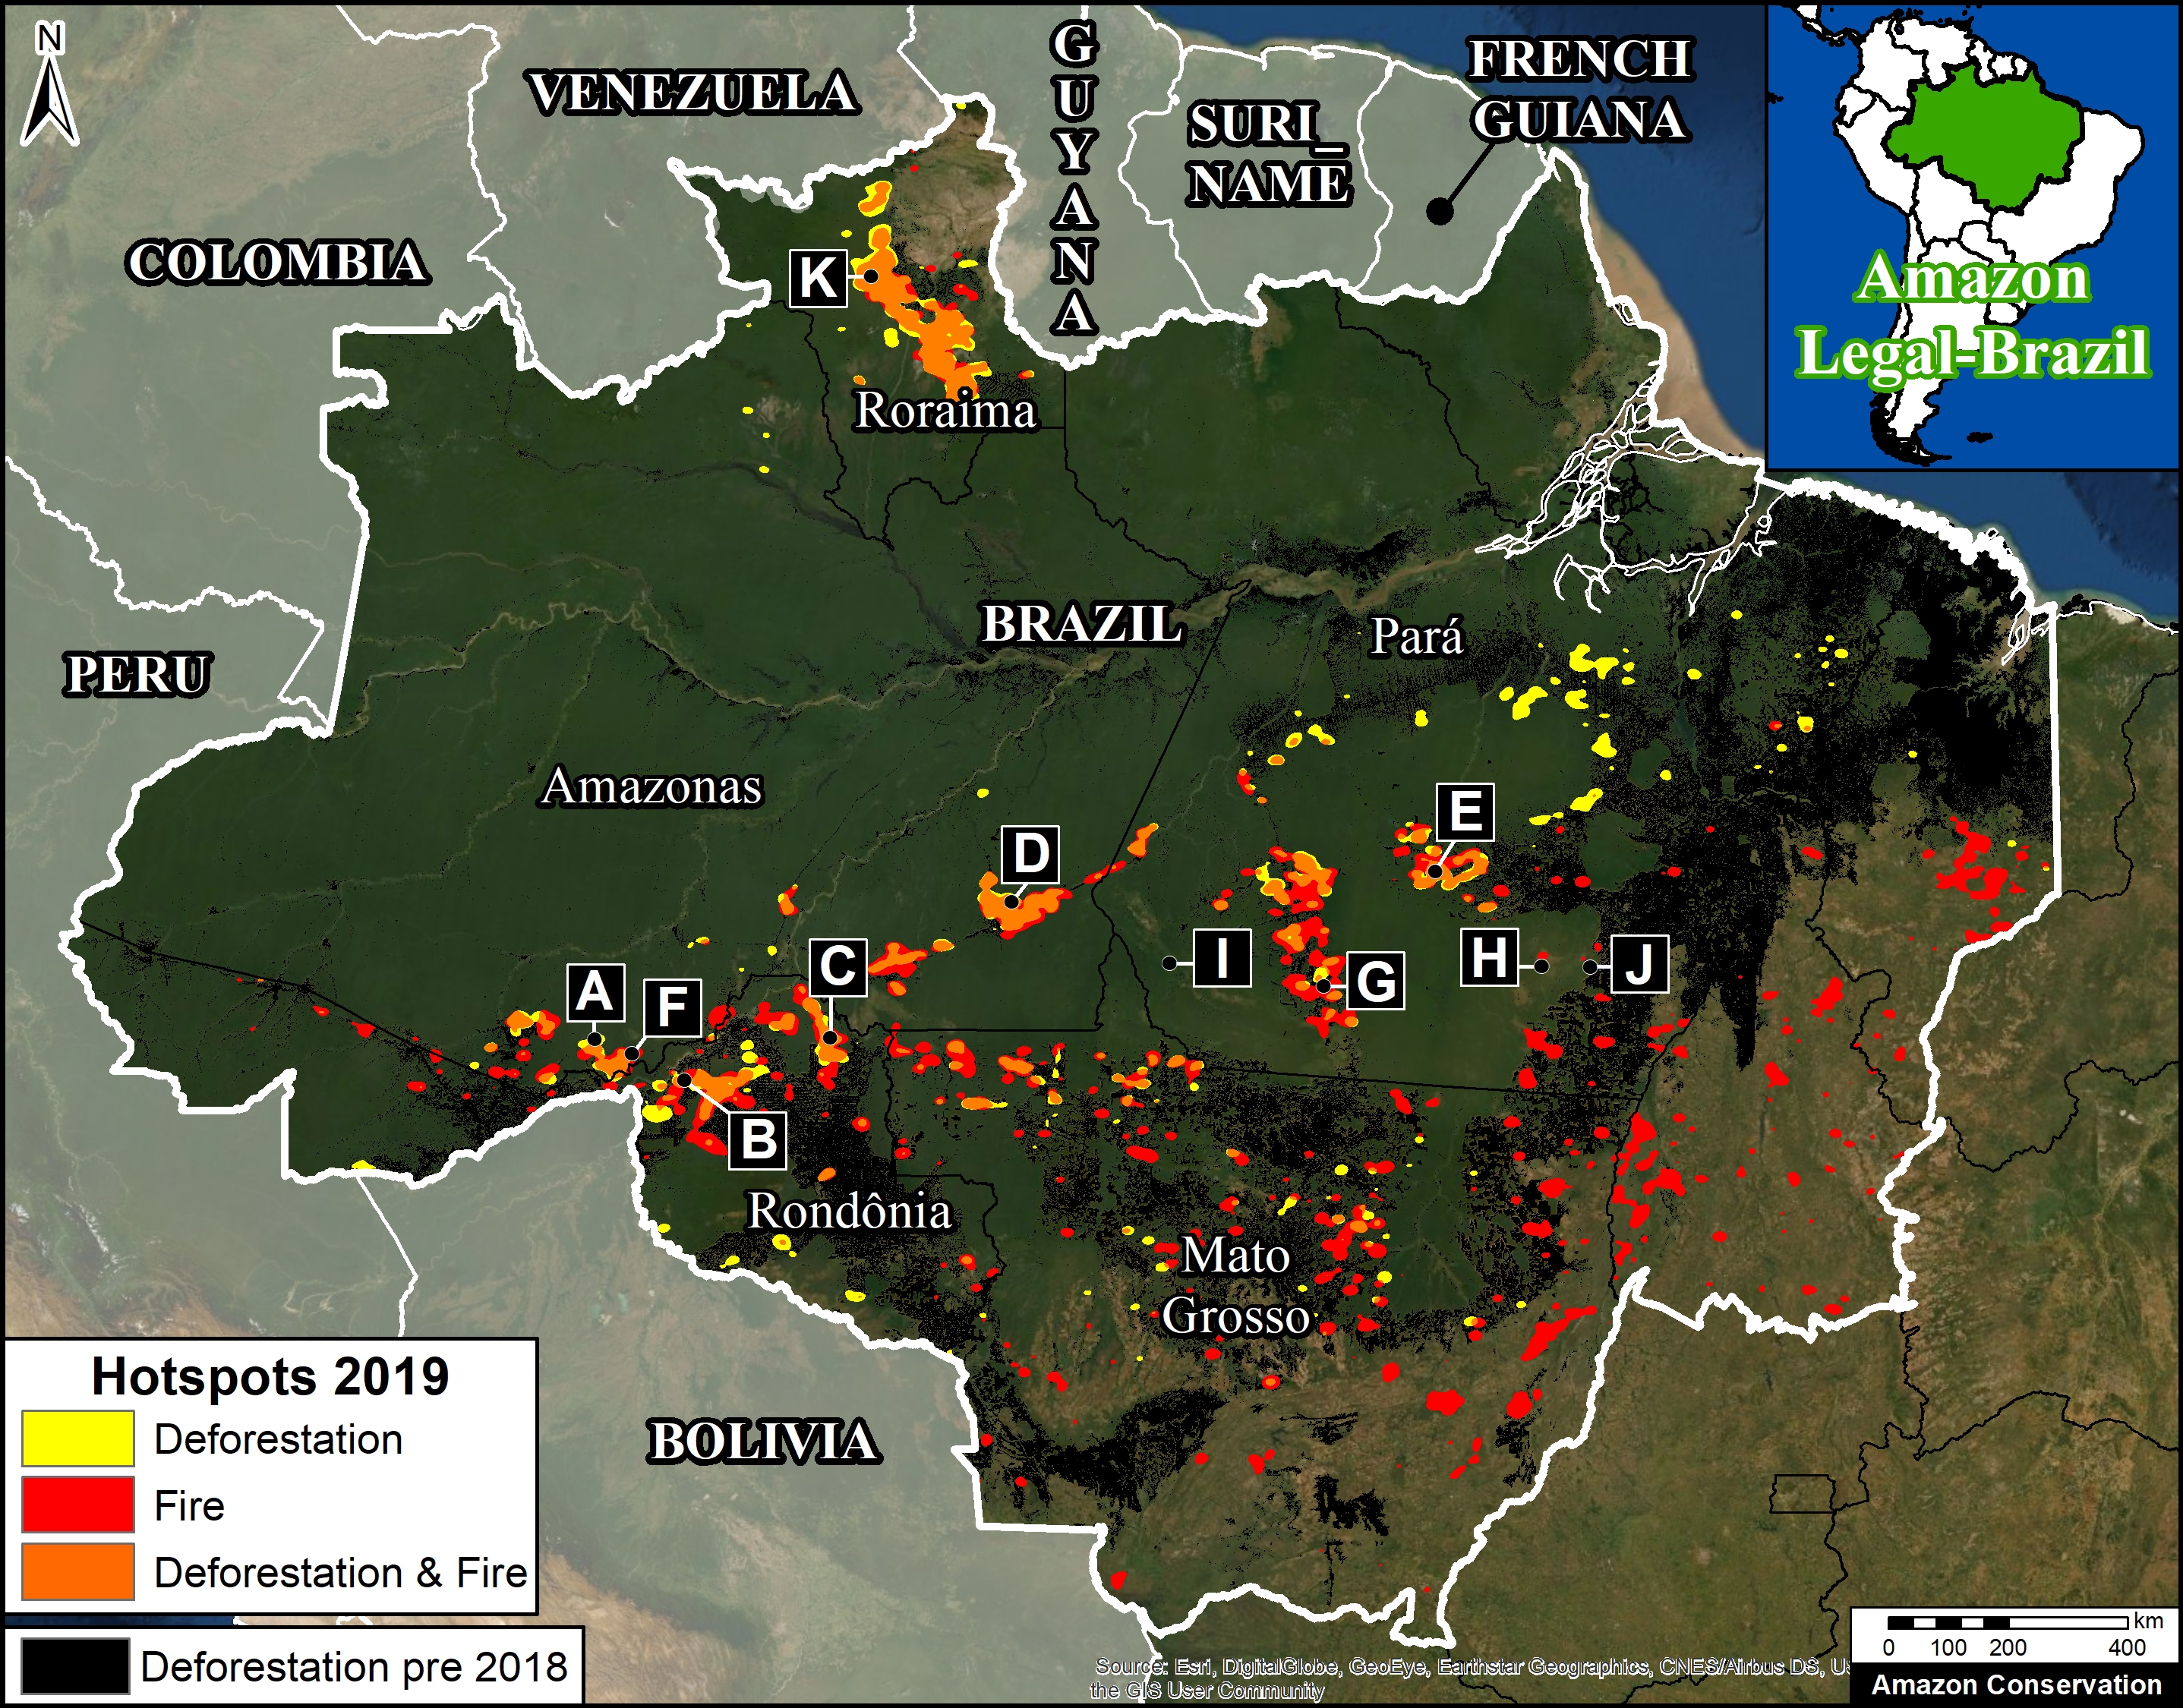
Base Map. 2019 deforestation and fire hotspots in the Brazilian Amazon. Data: UMD/GLAD, NASA (MODIS), PRODES
The fires in the Brazilian Amazon have been the subject of intense global attention over the past month.
As part of our ongoing coverage, we go a step further and analyze the relationship between fire and deforestation in 2019.
First, we present the first known Base Map showing both 2019 deforestation and fire hotspots, and, importantly, the areas of overlap. The letters correspond to Zooms below.
Second, we present a series of 16 high-resolution timelapse videos (Zooms A-K), courtesy of the satellite company Planet. They show five scenarios that we have documented thus far in 2019:
- Deforestation (No Fire)
- Deforestation (Followed by Fire)
- Agriculture Fire
- Savanna Fire
- Forest Fire
The key finding is that Deforestation (Followed by Fire) is critically important to understandng this year’s fire season (see Zooms B-E).
We documented numerous cases of 2019 deforestation events followed by intense fires, covering at least 52,500 hectares (130,000 acres) and counting. That is equivalent to 72,000 soccer fields.
The other common scenario is Agriculture Fire in areas cleared prior to 2019, but close to surrounding forest (see Zooms F and G).
We are also now seeing more examples of Savanna Fire in grassland areas among the rainforest. These fires can be large — we show a 24,000 hectare burn (60,000 acres) in Kayapó indigenous territory (see Zoom H).
We did not observe major Forest Fires in the moist Brazilian Amazon during August, but we did document such fires in early March in Roraima state. As the dry season continues into September and October, however, forest fires become a greater risk.
1. Deforestation (No Fire)
Zoom A shows the large-scale deforestation of 1,450 hectares (3,600 acres) in Amazonas state between April and August 2019. The deforestation seems to be for agricultural purposes and shows no signs of fire.
Zoom A. Deforestation (no Fire). Data: Planet, ESA.
2. Deforestation (Followed by Fire)
The key finding of this analysis was the widespread scenario of major deforestation events followed by intense fires. This (and not Forest Fire) likely explains why many fires were quite smoky. Below we show four examples from the Amazonian states of Rondônia (Zooms B and C), Amazonas (Zoom D), and Pará (Zoom E). In these four examples, we directly measured 8,500 hectares (21,000 acres) that were deforested and then burned in 2019.
Zoom B. Deforestation (Followed by Fire) in Rondônia. Data: Planet, ESA.
Zoom C. Deforestation (Followed by Fire) in Rondônia. Data: Planet, ESA.
Zoom D. Deforestation (Followed by Fire) in Amazonas. Data: Planet, ESA.
Zoom E. Deforestation (Followed by Fire) in Pará. Data: Planet, ESA.
3. Agriculture Fire
Zooms F and G show the other widespread scenario of fires clearing agriculture areas. In most cases, the fires seem contained to the agriculture area, but we have found examples of burning surrounding forest (but not turning into runaway forest fires). As the dry season continues, however, there is an elevated risk of agricultural fires escaping into the surrounding forest and causing larger fires.
Zoom F. Agriculture fire. Data: Planet, ESA.
Zoom G. Agriculture fire. Data: Planet, ESA.
4. Savanna Fire
We have recently been detecting fires burning through drier ecosystems, such as savannas, located in pockets among the moist rainforest. Zooms H and I show savanna fires in Kayapó and Munduruku indigenous territories, respectively. These savanna fires can burn large areas, for example more than 24,000 hectares (60,000 acres) in Kayapó territory , and 700 hectares (1,700 acres) in Munduruku territory.
Zoom H. Savanna fire in Kayapó indigenous territory. Data: Planet, ESA.
Zoom I. Savanna fire in Munduruku indigenous territory. Data: Planet, ESA.
5. Forest Fire
During August we have not documented large forest fires in the moist forests of the western Brazilian Amazon, our main focal area. Forest fires may be more common in the eastern Brazilian Amazon, especially as we get deeper into the burning season. For example, Zoom J shows some recent fires in the ridges of Kayapó indigenous territory that have burned around 930 hectares (2,300 acres).
Zoom J. Forest fire in the ridges of Kayapó indigenous territory. Data: Planet, ESA.
It is important to note that we have not yet documented any large, runaway fires through the moist forests of the Brazilian Amazon that seem to be the media and public perception of the situation. The large fires we have seen are in the dry and scrub forests of the Brazilian and Bolivian Amazon (see MAAP #108). Interestingly however, there were major forest fires earlier in the year (early March) in northern Brazil (Roraima state). Zoom I shows an example of these fires near Yanomami indigenous territory.
Zoom K. Forest fire in early March 2019 in Roraima state. Data: Planet, ESA.
Methods
We created two “hotspots” layers, one for deforestation and the other for fires, by conducting a kernel density analysis. This type of analysis calculates the magnitude per unit area of a particular phenomenon, in this case forest loss alerts (proxy for deforestation) and temperature anomaly/fire alerts.
We used GLAD alert forest loss data (30 meter resolution) from the University of Maryland and available on Global Forest Watch. Data thru August 2019.
We used NASA’s Fire Information for Resource Management System (FIRMS) MODIS-based fire alert data (1 km resolution). Data thru August 2019.
We conducted the analysis using the Kernel Density tool from Spatial Analyst Tool Box of ArcGIS, using the following parameters:
Search Radius: 15000 layer units (meters)
Kernel Density Function: Quartic kernel function
Cell Size in the map: 200 x 200 meters (4 hectares)
Everything else was left to the default setting.
For the Base Map, we used the following concentration percentages: Medium: 10%-25%; High: 26%-50%; Very High: >50%. We then combined all three categories into one color (yellow for deforestation and red for fire). Orange indicates areas where both layers overlap. As background layer, we also included pre-2019 deforestation data from Brazil’s PRODES system.
Acknowledgements
We thank G. Hyman (SIG), A. Flores (NASA-SERVIR), and A. Folhadella (ACA) for helpful comments to earlier versions of this report.
This work was supported by the following major funders: MacArthur Foundation, International Conservation Fund of Canada (ICFC), Metabolic Studio, and Global Forest Watch Small Grants Fund (WRI).
Citation
Finer M, Mamani N (2019) Fires and Deforestation in the Brazilian Amazon, 2019. MAAP: 109.
Download PDF of this article