MAAP #46: Gold Mining Deforestation Within Tambopata National Reserve Exceeds 450 Hectares

In previous articles, we documented the illegal gold mining invasion of Tambopata National Reserve (Madre de Dios region in the southern Peruvian Amazon) in November 2015 and the subsequent deforestation of 350 hectares as of July 2016. Here, we report that the mining deforestation in the Reserve now exceeds 450 hectares (1,110 acres) as of September 2016. Image 46a illustrates the extent of the invasion, with red indicating the most recent deforestation fronts. Insets A-D indicate the location of the high-resolution zooms below.

Imagen 46a. Datos: Planet, SERNANP, MAAP
Image 46a. Data: Planet, SERNANP, MAAP

High Resolution Zooms

Images 45b-e show, in high-resolution, the recent deforestation within Tambopata National Reserve between July (left panel) and September (right panel) 2016. These areas correspond to Insets A-D. The red circles indicate the primary areas of new deforestation between these dates. Click on images to enlarge.

Imagen 45b. Datos: Planet, SERNANP
Image 45b. Data: Planet, SERNANP
Imagen 45c. Datos: Planet, SERNANP
Image 45c. Data: Planet, SERNANP
Imagen 45d. Datos: Planet, SERNANP
Image 45d. Data: Planet, SERNANP
Imagen 45e. Datos: Planet, SERNANP
Image 45e. Data: Planet, SERNANP

Citation

Finer M, Olexy T, Novoa S (2016) Gold Mining Deforestation Within Tambopata National Reserve Exceeds 450 Hectares. MAAP: #46

MAAP #45: Threats to El Sira Communal Reserve in central Peruvian Amazon

esira_recovery_o_v2_en
Image 45a. Data: ESRI, SERNANP

El Sira Communal Reserve, located in the central Peruvian Amazon (regions of Pasco, Huánuco and Ucayali), aims to protect the biological diversity of the El Sira Mountain Range in benefit of the native communities of the area (Ashaninka, Yanesha, and Shipibo-Conibo indigenous groups).

This report presents an initial threat assessment for this large national protected area, which covers more than 615,000 hectares (1.5 million acres).

We identified 3 threatened sectors of the Reserve, as indicated in Image 45a (see Insets A-C).

We found that the principal drivers of deforestation in these three sectors are agriculture & cattle pasture (Insets A and C) and illegal gold mining (Inset B).

It is important to note that the deforestation for agriculture & cattle pasture continues to rapidly increase – 1,600 hectares (3,950 acres) since 2013 – while the deforestation for gold mining has been limited due to regular interventions by the Peruvian government.

Below, we show high-resolution satellite images of the recent deforestation in all three threatened sectors. Click each image to enlarge.


Inset A: Increasing Deforestation in the Northern Sector

esira_recovery_a_v3_en
Image 45b. Data: UMD/GLAD, Hansen/UMD/Google/USGS/NASA, USGS/NASA, SERNANP

Image 45b illustrates the increasing deforestation in the northern sector of the El Sira Communal Reserve.

We documented the deforestation of 285 hectares (700 acres) within the Reserve thus far in 2016 (as of late August). Over 90% of this loss comes from small-scale deforestation events (less than 5 hectares).

We calculated an additional deforestation of 1,320 hectares (3,260 acres) within the Reserve between 2013 and 2015.

Thus, we documented a total deforestation of 1,600 hectares (3,950 acres) within the northern sector of the Reserve since 2013.

Based on the analysis of high-resolution imagery, we found that the principal driver of this deforestation was agriculture & cattle pasture.

Note that this sector is near the deforestation hotspot described in MAAP #37, where we determined that cattle pasture was the principal driver of deforestation.

Insets A1 – A3 indicate the location of the high-resolution zooms described below.


Images 45c-45d show examples of deforestation between September 2015 (left panel) and August/September 2016 (right panel). The red circles indicate newly deforested areas in 2016. The yellow circles indicate areas deforested in 2015 and subsequently converted to cattle pasture in 2016.

esira_recovery_a1_m_v1_en
Image 45c. Data: Digital Globe (Next View), Planet
esira_recovery_a2_m_v1_en
Image 45d. Data: Digital Globe (Next View), Planet


Image 45e shows examples of deforestation between September 2015 (left panel) and August/September 2016 (right panel). The yellow circles indicate areas deforested in 2015 and subsequently converted to cattle pasture in 2016. The blue circles indicate recently burned areas (note the smoke in the right) panel. This type of annual burning pattern is characteristic of cattle-grazing areas.

esira_recovery_a3_m_v1_en
Image 45e. Data: Digital Globe (Next View), Planet

Inset B: Illegal Gold Mining Activity

esira_recovery_b_v3_en
Image 45f. Data: UMD/GLAD, Hansen/UMD/Google/USGS/NASA, USGS/NASA, SERNANP

Illegal gold mining currently threatens the upper Negro River, located in the northwest sector of the Reserve (see Inset B of Image 45a).

During 2015 and 2016, the Peruvian government has carried out several interventions against this illegal mining.

Image 45f shows the recent deforestation along the upper Negro River. Insets B1-B3 indicate the areas detailed below in high resolution.


Images 45g-h show recently deforested areas (indicated by yellow circles) between 2015 (left panel) and 2016 (right panel). These areas have been the target of recent government interventions; note that within the red circles the mining machinery has been eliminated between August and September 2016.

esira_recovery_b1_a_m_v1_en
Image 45g. Data: Digital Globe (NextView)
esira_recovery_b2_a_m_v1_en
Image 45h. Data: Digital Globe (NextView)


Image 45i shows a mining area abandoned between 2015 and 2016.

esira_recovery_b3_a_m_v1_en
Image 45i. Data: Digital Globe (NextView)

New Deforestation Zones

Image 45j shows the recent deforestation of 8.6 hectares (21 acres) between August (left panel) and September (right panel) 2016, within the area indicated by Inset B4 in Image 45f.

esira_recovery_b4_m_v1_en
Image 45j. Data: Digital Globe (Nextview)

Image 45k shows the recent deforestation of 12 hectares (30 acres) within a remote area located in the northeast sector of the Reserve (see Inset C in Image 45a for context).

esira_recovery_c_m_v1_en
Image 45j. Data: Planet

Citation

Novoa S, Finer M, Snelgrove C (2016) Threats to Peru’s El Sira Communal Reserve. MAAP: 45

MAAP #44: Potential Recuperation of Illegal Gold Mining area in Amarakaeri Communal Reserve

In the previous MAAP #6, published in June 2015, we documented the deforestation of 11 hectares in the Amarakaeri Communal Reserve due to a recent illegal gold mining invasion. The Reserve, located in the Madre de Dios region of the southern Peruvian Amazon, is an important protected area that is co-managed by indigenous communities and Peru’s National Protected Areas Service (known as SERNANP). In the following weeks, the Peruvian government, led by SERNANP, cracked down on the illegal mining activities and effectively halted the deforestation within that part of the Reserve.

Here, we present high-resolution satellite images that show an initial vegetation regrowth in the invaded area. This finding may represent good news regarding the Amazon’s resilience to recover from destructive mining if it is stopped at an early stage. However, many questions and caveats remain regarding the nature of the regrowth and the long-term recovery potential of the degraded land, please see the Additional Information section below for more details.

Image 44a shows the base map of the area invaded by illegal gold mining in the southeast sector of Amarakaeri Communal Reserve. Insets A–D indicate the areas featured in the high-resolution zooms below.

Image 44a. Data: Digital Globe (Nextview), SERNANP

High-Resolution Zooms

Images 44b-e show, in high-resolution, areas where we detected vegetation regrowth between September 2015 (left panel) and August 2016 (right panel) following the gold mining invasion.

Image 44b. Data: Digital Globe (Nextview)
Image 44c. Data: Digital Globe (Nextview)
Image 44d. Data: Digital Globe (Nextview)
Image 44e. Data: Digital Globe (Nextview)

Additional Information

The natural vegetation regrowth observed in the images is not totally unexpected considering the area’s high biological diversity, the presence of nearby primary forest, and the relatively small area invaded prior to the government intervention. However, it’s important to consider that the regrowth has occurred mainly on the mounds of soil that were left behind by the mining activity. The regrowth is not yet evident in the other mining areas where the soil alteration was more severe. Further investigation is needed to better understand the characteristics of the regrowth and explore the true restoration potential of the area. Extreme degradation and mercury contamination left behind by mining activities may prevent many species from returning, allowing only the establishment of a few hardy colonizing specialist species.

Citation

Novoa S, Finer M, Román F (2016) Regeneration of Vegetation in Zone Affected by Gold Mining in the Amarakaeri Communal Reserve. MAAP: 44.

MAAP #43: Early Warning Deforestation Alerts in the Peruvian Amazon, Part 2

In the previous MAAP #40, we emphasized the power of combining early warning forest loss GLAD alerts with analysis of high-resolution satellite imagery as part of a comprehensive near real-time deforestation monitoring system for the Peruvian Amazon.

In the current MAAP, we present 3 new examples of this system across different regions of Peru. Click on the images below to enlarge.

Example 1: Illegal Gold Mining in buffer zone of Bahuaja Sonene National Park (Madre de Dios)
Example 2: Logging Road in buffer zone of Cordillera Azul National Park (Ucayali/Loreto)
Example 3: Deforestation in Permanent Production Forest (Ucayali)

Example 1: Illegal Gold Mining in buffer zone of Bahuaja Sonene National Park (Madre de Dios)

In the previous MAAP #5, we discussed illegal gold mining deforestation along the upper Malinowski River, located in the buffer zone of the Bahuaja Sonene National Park. As seen in Image 43a, the upper Malinowski is just upstream of the areas invaded by illegal gold mining in Tambopata National Reserve and its buffer zone (see MAAP #39 and #31, respectively). In MAAP #5, we documented the deforestation of more than 850 hectares between 2013 and 2015 along the upper Malinowski. Here, we show that gold mining deforestation continues in 2016, with an additional loss of 238 hectares (806 acres). Insets A-C correspond to the areas featured in the high-resolution zooms below.

Image 43a. Data: UMD/GLAD, Hansen/UMD/Google/USGS/NASA, NASA/USGS, SERNANP

The following Images 43b-d show, in high-resolution, the rapid expansion of gold mining deforestation between August/September 2015 (left panel) and July/August 2016 (right panel). The yellow circles indicate the main areas of deforestation between the images.

Imagen 43b. Datos: Planet, Digital Globe (Nextview)
Image 43b. Data: Planet, Digital Globe (Nextview)
Imagen 43c. Datos: Planet, Digital Globe (Nextview)
Image 43c. Data: Planet, Digital Globe (Nextview)
Imagen 43d. Datos: Planet, Digital Globe (Nextview)
Image 43d. Data: Planet, Digital Globe (Nextview)

Example 2: Logging Road in buffer zone of Cordillera Azul National Park (Ucayali/Loreto)

In the previous MAAP #18, we discussed the proliferation of logging roads in the central Peruvian Amazon in 2015. Here, we show the expansion of two of these logging roads in 2016. (see Image 43e). Red indicates construction during 2016 (47 km). Insets A1-A3 correspond to the areas featured in the high-resolution zooms below. Note that the northern road (Inset A3) is within the buffer zone of Cordillera Azul National Park. Evidence suggests that this road is not legal because it extends out of the permited area (see MAAP #18 for more details).

Imagen 43e. Datos: UMD/GLAD, Hansen/UMD/Google/USGS/NASA, SERNANP
Image 43e. Data: UMD/GLAD, Hansen/UMD/Google/USGS/NASA, SERNANP

The following images show, in high-resolution, the rapid construction of these logging roads. Image 43f shows the construction of part of the southern road (Inset A1), and the deforestation for a nearby agricultural parcel, between April (left panel) and July (right panel) 2016. Image 43g shows the construction of 1.8 km in just three days along this same road (Inset A2) between July 21 (left panel) and July 24 (right panel) 2016.

Imagen 43f. Datos: Planet
Image 43f. Data: Planet
Imagen 43g. Datos: Planet
Image 43g. Data: Planet

Image 43h shows the construction of 13 km on the northern road between November 2015 (left panel) and July 2016 (right panel) within the buffer zone of the Cordillera Azul National Park.

Imagen 43h. Datos: Planet
Image 43h. Data: Planet

Example 3: Deforestation in Permanent Production Forest  (Ucayali)

Image 43i shows recent deforestation of 136 hectares (336 acres) in 2016 in southern Ucayali region within areas classified as Permanent Production Forest and Foresty Concession. These types of areas are generally zoned for sustainable forestry uses, not clear-cutting, thus we question the legality of the deforestation. Tables A-B correspond to the areas featured in the high-resolution zooms, below.

Imagen 43i. Datos: UMD/GLAD, Hansen/UMD/Google/USGS/NASA, MINAGRI
Image 43i. Data: UMD/GLAD, Hansen/UMD/Google/USGS/NASA, MINAGRI

Image 43j shows deforestation within a section of Permanent Production Forest, and Image 43k shows deforestation within a section of Forestry Concession.

Imagen 43j. Datos: Planet
Image 43j. Data: Planet
Imagen 43k. Datos: Planet
Image 43k. Data: Planet

Citation

Finer M, Novoa S, Goldthwait E (2016) Early Warning Deforestation Alerts in the Peruvian Amazon, Part 2. MAAP: 43.

MAAP #42: Papaya – New Deforestation Driver in Peruvian Amazon

In the previous MAAP #26, we published a preliminary map of Deforestation Hotspots in the Peruvian Amazon for 2015. Subsequently in 2016, we have been compiling information to improve understanding on the potential causes (drivers) of deforestation in the identified hotspots. In this article, we focus on a medium-intensity hotspot located along the newly paved Interoceanic Highway in the eastern part of the Madre de Dios region (see Inset A in Image 42a).

Image 42a. Data. UMD/GLAD, MTC, MAAP

The analysis in this article is based on field work carried out by the Peruvian Ministry of Environment, in collaboration with Terra-i. This team has verified the presence of papaya plantations in the area indicated by Inset A and shared their photos and coordinates with MAAP to allow us to search for and analyze relevant satellite imagery.

Synthesizing all of the available information, we found that the establishment of papaya plantations was an important deforestation driver in the area in 2015. Within the focal area (Inset A), we estimate the deforestation of 204 hectares (504 acres) for papaya plantations in 2015, a major increase relative to 2014 (see bar graph in Image 42a).

All of the papaya deforestation is small (< 5 hectares) or medium (5-50 hectares) scale. According to the analysis presented in MAAP #32, these two scales represented 99% of the deforestation events in Peru in 2015. Approximately 90% of the observed deforestation is within areas zoned for agricultural activity. Therefore, the legality of the deforestation in not known (i.e. if all the required permits were obtained).

Below, we show satellite images and field photos of 5 examples of the recent deforestation caused by papaya cultivation.

Example #1

Image 42b shows the deforestation of 12 hectares between September 2013 (left panel) and January 2016 (right panel). The red point indicates the same place in both images. Image 42c is a photo of the new papaya plantation in this area.

Image 42b. Data: Digital Globe (Nextview), Planet Labs
c. point-37-source-minam---dgot-detection-by-terra-i-8132014-driver-papaya_25582479922_o
Image 42c. Photo: MINAM/DGOT, Terra-i

Example #2

Image 42d shows the deforestation of 5 hectares between September 2013 (left panel) and January 2016 (right panel). The red point indicates the same place in both images. Image 42e is a photo of the new papaya plantation in this area.

Image 42d. Digital Globe (Nextview), Planet Labs
e. point-11-source-minam-detection-by-terra-i-112015-driver-papaya_25051222004_o
Image 42e. Photo: MINAM/DGOT, Terra-i

Example #3

Image 42f shows the deforestation of 5 hectares between September 2013 (left panel) and January 2016 (right panel). The red point indicates the same place in both images. Image 42g is a photo of the new papaya plantation in this area.

Image 42f. Digital Globe (Nextview), Planet Labs
Imagen G. MINAM/DGOT, Terra-i
Image 42g. MINAM/DGOT, Terra-i

Example #4

Image 42h shows the deforestation of 12 hectares between September 2013 (left panel) and May 2016 (right panel). The red point indicates the same place in both images. Image 42i is a photo of the new papaya plantation in this area.

Image 42h. MINAM/DGOT, Terra-i
Imagen I. MINAM/DGOT, Terra-i
Image 42i. Photo: MINAM/DGOT, Terra-i

Example #5

Image 42j shows the deforestation of 9 hectares between April 2015 (left panel) and May 2016 (right panel). The yellow boxes indicate the same place in both images. Image 42k is a photo of the new papaya plantation in this area.

Image 42j. MINAM/DGOT, Terra-i
Imagen J. MINAM/DGOT, Terra-
Image 42k. Photo: Farah Carrasco

Citation

Finer M, Novoa S, Carrasco F (2016) Papaya – Potential New Driver of Deforestation in Madre de Dios. MAAP: 42.

MAAP #41: Confirming Large-scale Oil Palm Deforestation in the Peruvian Amazon

In the previous MAAP #4, we documented the deforestation of 6,464 hectares (15,970 acres) between 2011 and 2015 associated with a large-scale oil palm project in the central Peruvian Amazon (Ucayali region) operated by the company Plantaciones de Pucallpa. In addition, we found that the majority of this deforestation occurred in primary forests,1 although there was also clearing of secondary vegetation.

In December 2015, the Native Community of Santa Clara de Uchunya presented an official complaint to the Roundtable on Sustainable Palm Oil (RSPO) against Plantaciones de Pucallpa, a member of the roundtable. An important component of the complaint centers on the deforestation described above, however the company has repeatedly denied causing it.

To better understand the deforestation in question, we compare three high-resolution satellite images: 1) July 2010, the most recent high-resolution, color image prior to the start of large-scale deforestation in May 2012; 2) June 2012, a black and white image from the time period when large-scale deforestation began; 3) September 2015, color image showing the established oil palm plantation.

Image 41a shows a base map of the project area in July 2010 (left panel), June 2012 (center panel), and September 2015 (right panel). We indicate areas of primary forest and secondary vegetation,2 recently deforested areas, and oil palm plantation. The images show that large-scale deforestation had begun by June 2012, and by 2015 there was a complete transformation of primary forest and secondary vegetation to large-scale oil palm plantationInsets A-F show the areas detailed in the zooms below. Click on images to enlarge.

Image 41a. Data: Digital Globe (Nextview), MAAP


Zoom A: Primary Forest

Images 41b-i show the zooms of the areas (Insets A – D) in which installation of the oil palm plantation replaced primary forest. The images show primary forest in July 2010 (left panel) and June 2012 (center panel) replaced by oil palm plantation in September 2015 (right panel). Note that in Inset D (Images 41h-i), recently cleared trees can seen as the large-scale deforestation was just starting at that time3.

Image 41b. Data: Digital Globe (Nextview)
Image 41c. Data: Digital Globe (Nextview)

Zoom B: Primary Forest

Image 41d. Data: Digital Globe (Nextview)
Image 41e. Data: Digital Globe (Nextview)

Zoom C: Primary Forest

Image 41f. Data: Digital Globe (Nextview)
Image 41g. Data: Digital Globe (Nextview)

Zoom D: Primary Forest

Image 41h. Data: Digital Globe (Nextview)

NRequenaD1Image 41i. Data: Digital Globe (Nextview)

Zoom E: Secondary Vegetation

Images 41j-m show the zooms of the areas (Insets E – F) in which the oil palm plantation replaced secondary vegetation. The images show secondary vegetation in July 2010 (left panel) and June 2012 (center panel) replaced by oil palm plantation in September 2015 (right panel).

Image 41j. Data: Digital Globe (Nextview)
Image 41k. Data: Digital Globe (Nextview)

Zoom F: Secondary Vegetation

Image 41l. Data: Digital Globe (Nextview)
Image 41m. Data: Digital Globe (Nextview)

Notes

We define primary forest as an area that, from the first available Landsat image (in this case 1990), was characterized by a forest cover of closed and dense canopy. This definition is consistent with the official definition of the new Forest Law: “Forest with original vegetation characterized by the abundance of mature trees with superior or dominant species canopy, which has evolved naturally.”

2 Primary and secondary forest classifications come from the analysis published in MAAP #4

3 Analysis of additional satellite imagery reveals that the large-scale clearing started between May and June 2012.

Citation

Finer M, Cruz C, Novoa S (2016) Confirming Deforestation for Oil Palm by the company Plantations of Pucallpa. MAAP: 41

MAAP #40: Early Warning Deforestation Alerts in the Peruvian Amazon

GLAD alerts are a powerful new tool to monitor forest loss in the Peruvian Amazon in near real-time. This early warning system, created by the GLAD (Global Land Analysis and Discovery) laboratory at the University of Maryland and supported by Global Forest Watch, was launched in March 2016 as the first Landsat-based (30-meter resolution) forest loss alert system (previous systems were based on lower-resolution imagery). The alerts are updated weekly and can be accessed through Global Forest Watch (Image 40a, left panel) or GeoBosques (Image 40a, right panel), a web portal operated by the Peruvian Ministry of Environment.

Imagen 41a. Datos: UMD/GLAD, WRI/GFW, PNCB/MINAM
Image 40a. Data: UMD/GLAD, WRI/GFW, PNCB/MINAM

In MAAP, we often combine these alerts with analysis of high-resolution satellite imagery (courtesy of the Planet Ambassador Program and Digital Globe NextView service) to better understand patterns and drivers of deforestation in near real-time. In this article, we highlight 3 examples of this type of innovative analysis from across the Peruvian Amazon:

Example 1: Logging Roads in central Peru (Ucayali)
Example 2: Invasion of Ecotourism Concessions in southern Peru (Madre de Dios)
Example 3: Buffer Zone of Cordillera Azul National Park (Loreto)

Example 1: Logging Roads in central Peru (Ucayali)

In the previous MAAP #18, we documented the proliferation of logging roads in the central Peruvian Amazon during 2015. In recent weeks, we have seen the start of rapid new logging road construction for 2016. Image 40b shows the linear forest loss associated with two new logging roads along the Tamaya river in the remote central Peruvian Amazon (Ucayali region). Red indicates the 2016 road construction (35.8 km). Insets A and B indicate the areas shown in the high-resolution zooms below.

Image 40b. Data: UMD/GLAD, Hansen/UMD/Google/USGS/NASA, MINAGRI

The following images show, in high-resolution, the rapid construction of logging roads in 2016. Image 40c shows the construction of 16.1 km between March (left panel) and July (right panel) 2016 in the area indicated by Inset A. Image 40d shows the construction of 19.7 km between June (left panel) and July (right panel) 2016 in the area indicated by Inset B.

Image 40c. Data: Planet
Image 40d. Data: Planet

Example 2: Invasion of Ecotourism Concessions in southern Peru (Madre de Dios)

Image 40e shows the recent deforestation within two ecotourism concessions along the Las Piedras River in the Madre de Dios region. Red indicates the 2016 GLAD alerts (67.3 hectares). Note that the Las Piedras Amazon Center (LPAC) Ecotourism Concession represents an effective barrier against deforestation occurring in the surrounding concessions. According to local sources, the main drivers of deforestation in the area are related to the establishment of cacao plantations and cattle pasture (see s MAAP #23). Inset A indicates the areas shown in the high-resolution zoom below.

Image 40e. Data: UMD/GLAD, Hansen/UMD/Google/USGS/NASA, MINAGRI

Image 40f shows high-resolution images of the area indicated by Inset A between April (left panel) and July (right panel) 2016. The yellow circles indicate areas of deforestation between these dates.

Image 40f. Data: Planet, DigitalGlobe (Nextview)

Example 3: Buffer Zone of Cordillera Azul National Park (Loreto)

Image 40g shows the recent deforestation within the western buffer zone of the Cordillera Azul National Park in the Loreto region. Red indicates the 2016 GLAD alerts (87.3 hectares). It is worth noting that this area is classified as Permanent Production Forest, not as an agricultural area.

Image 40g. Data: SERNANP, Landsat, UMD/GLAD, Hansen/UMD/Google/USGS/NASA

Image 40h shows high-resolution images of the area indicated by Inset A between December 2015 (left panel), January 2016 (central panel), and July 2016 (right panel). The yellow circles indicate areas that were deforested between these dates. The driver of the deforestation appears to be the establishment of small-scale agricultural plantations.

Image 40h. Data: RapidEye/Planet, Digital Globe (Nextview)

Citation

Finer M, Novoa S, Goldthwait E (2016) Early Alerts of Deforestation in the Peruvian Amazon. MAAP: 40.

MAAP #39: Gold Mining Deforestation Within Tambopata National Reserve Exceeds 350 Hectares

Based on analysis of satellite imagery, we have documented that the deforestation due to illegal gold mining activities within Tambopata National Reserve (Madre de Dios region) now exceeds 350 hectares (872 acres) since the initial invasion in late 2015 (see Image 39a). Although the rate of deforestation has decreased since April, when the Peruvian government installed a permanent control post* in the area, it is clear that the deforestation continues to expand.  In the Image, we highlighted the most recent deforestation (June and July 2016) in red to emphasize the current fronts. Insets A and B indicate the areas detailed in the zooms below.

*A recent article in the New York Times highlighted the extreme difficulty faced by the Peruvian government in cracking down on the illegal mining. Yesterday, the leading Peruvian newspaper El Comercio reported that the control post has been abandoned due to lack of resources.

Image 39a. Data: Planet, SERNANP, MAAP

Zoom A

In the following images, we show high-resolution examples of the recent deforestation within the reserve. Image 39b shows the deforestation that occurred between May 30 (left panel) and June 20 (right panel), 2016 in the area indicated by Inset A. The red circles indicate primary zones of new deforestation between these dates.

Image 39b. Data: Planet, SERNANP

Zoom B

Image 39c shows the deforestation between May 3 (left panel) and July 21 (right panel), 2016 in the area indicated by Inset B. The red circles indicate primary areas of new deforestation between these dates.

Image 39c. Data: Digital Globe (Nextview), SERNANP

Citation

Novoa S, Finer M, Olexy T (2016) Gold Mining Deforestation within Tambopata National Reserve exceeds 350 Hectares. MAAP: #39

MAAP #38: United Cacao deforestation in area classified as “Forest Production”

The Peruvian Ministry of Agriculture and Irrigation (MINAGRI) recently issued a resolution approving the Update of the Soil and Optimum Land Use Suitability Studies for Areas in the Loreto Region. It is important to emphasize that “Optimum Land Use” (Capacidad de Uso Mayor in Spanish)  is not determined by forest cover, but the quantitative interpretation of the soil, climate, and topography.

This new resolution represents an important advance in forest management in Peru because, according to both the previous1 and current2 Forestry Law, if the Optimum Land Use of a particular area is classified as Forest Production or Protection, it is illegal to change the land use to agriculture and cause deforestation. Thus, it is only possible to request land use change if the area has been classified as “Agriculture” (Optimum Land Use Annual Crop, Permanent Crop, or Pasture).3

Here, we analyze the spatial data corresponding to the new resolution. In Image 38a, we show that 92.6% (2,200 hectares) of the deforestation4 associated with the United Cacao project occurred on areas with an Optimum Land Use classification of Forest Production5. This classification “groups the lands in which climatic, terrain and soil conditions are not favorable for intensive cultivation, permanent crops, nor pastures, but for the production of timber species.”

Imagen 38a. Datos: MINAGRI
Image 38a. Data: MINAGRI 2016. Red lines indicate areas deforested by United Cacao between 2013 and 2016. Green indicates areas with Optimum Land Use classification of Forest Production, while the yellows indicate areas with Optimum Land Use classification of Agriculture.

In addition, 3.8% of the deforestation occurred in areas with an Optimum Land Use classification of Pasture/Forestry, while the remaining 3.6% occurred in areas with classification of Pasture. However, it is important to emphasize that even in these areas with an agricultural classification, our analysis of satellite imagery found that they were actually covered with primary forest (see Image 38b).

In conclusion, the vast majority of deforestation caused by United Cacao occurred in areas classified as optimally suited for forest production, where changes in land-use and associated deforestation are not permitted.

Imagen 38b. Datos: Landsat/NASA/USGS
Imagen 38b. Data: Landsat/NASA/USGS

Notes

1Ley 27308 Articulo 7. Decreto Supremo 014-2001-AG, Reglamento de la Ley Forestal y de Fauna Silvestre, Art. 36.

2 LEY FORESTAL Y DE FAUNA SILVESTRE (LEY Nº 29763), Artículo 37

3 Decreto Legislativo No. 653, Ley de Promocion de las Inversiones en el Sector Agrario (1991)

4 See MAAP #35 for more information regarding this deforestation.

Specifically, this area is classified as F2s: Tierras Aptas para Producción Forestal (Símbolo F), Clase – Calidad Agrológica Media (Símbolo F2),  Subclase – Limitación por Suelo (Símbolo “s”)

Citation

Finer M, Novoa S, Cruz C (2016) United Cacao deforestation in area classified as “Forest Production.” MAAP: 38.

MAAP #37: Deforestation Hotspot in the central Peruvian Amazon driven by Cattle Pasture

Image 36a. Data: UMD/GLAD
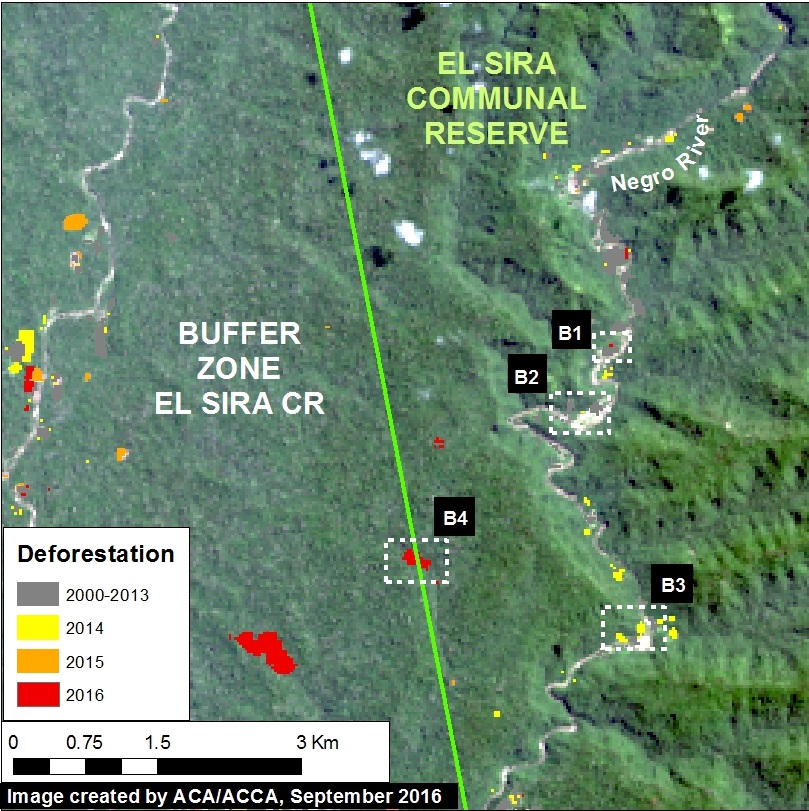
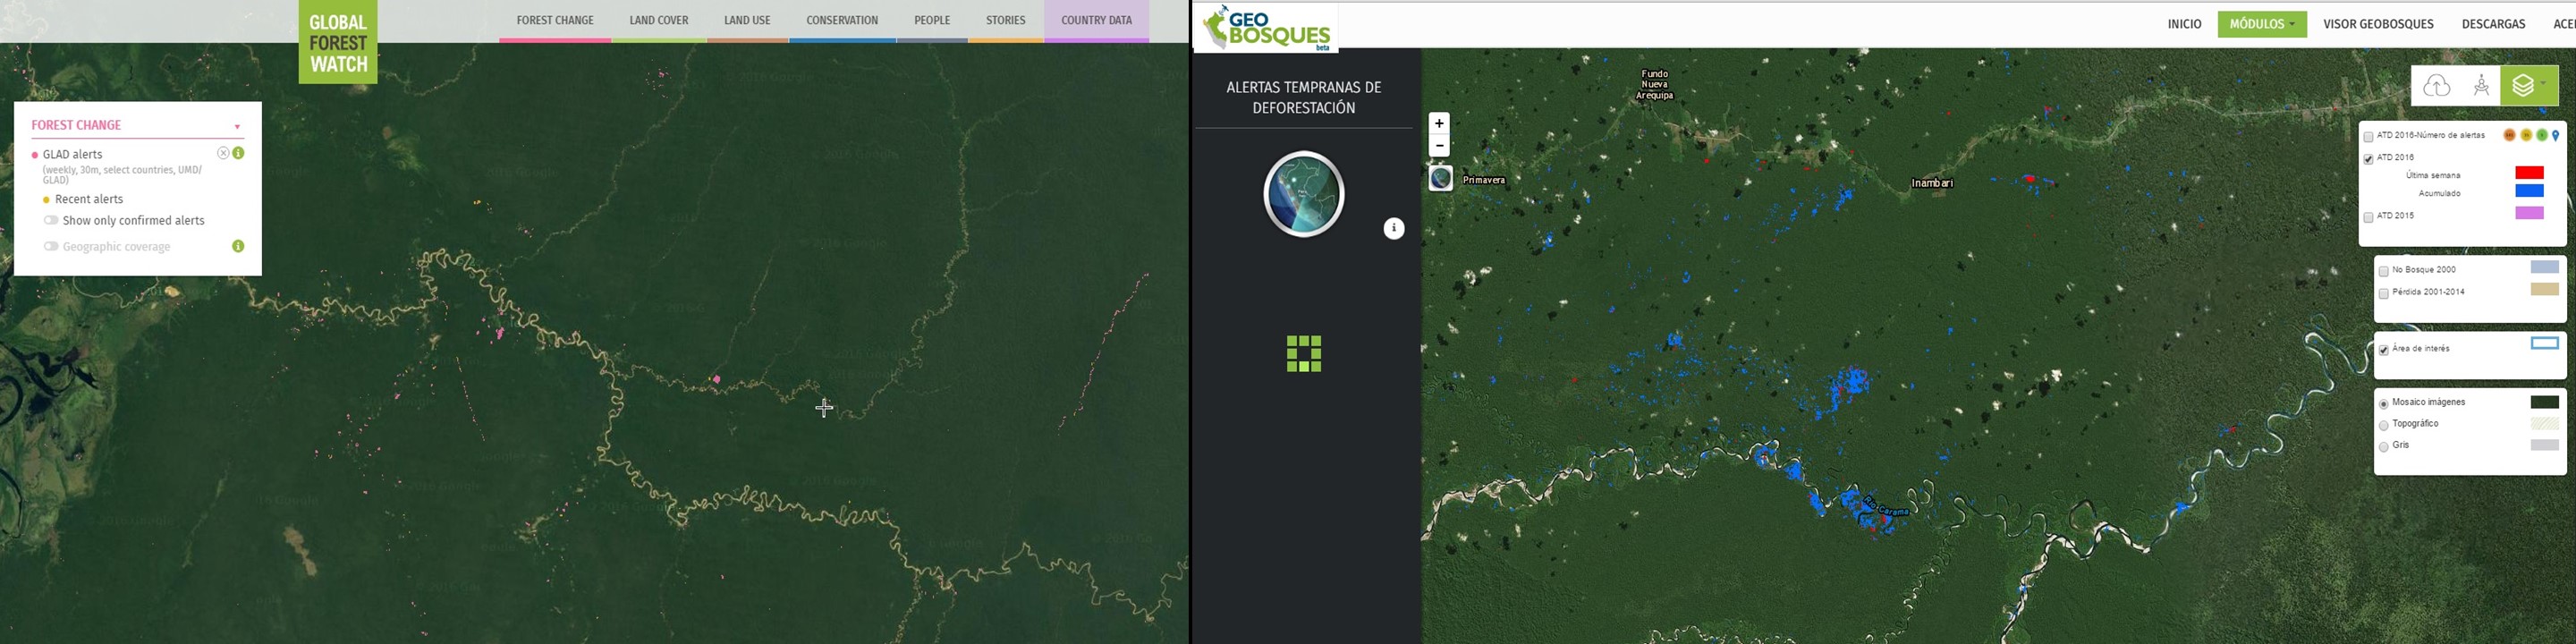
Image 37a. Data: UMD/GLAD

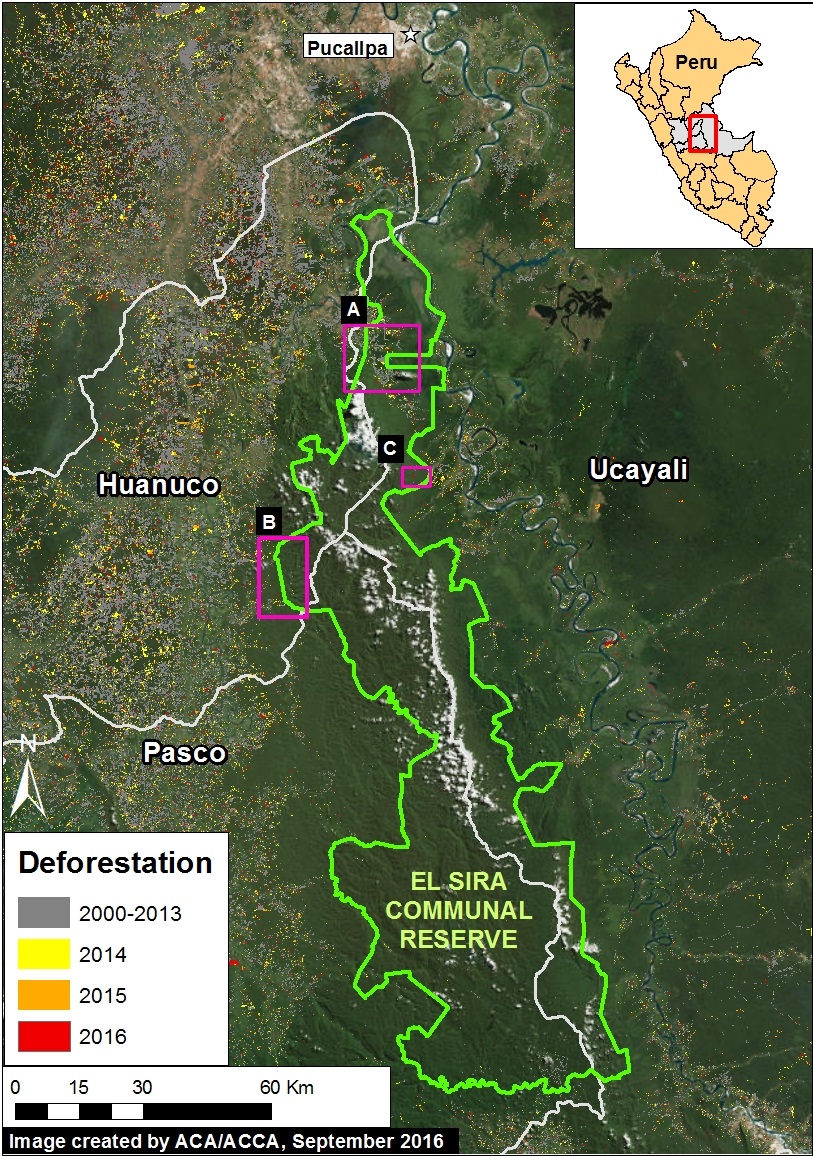
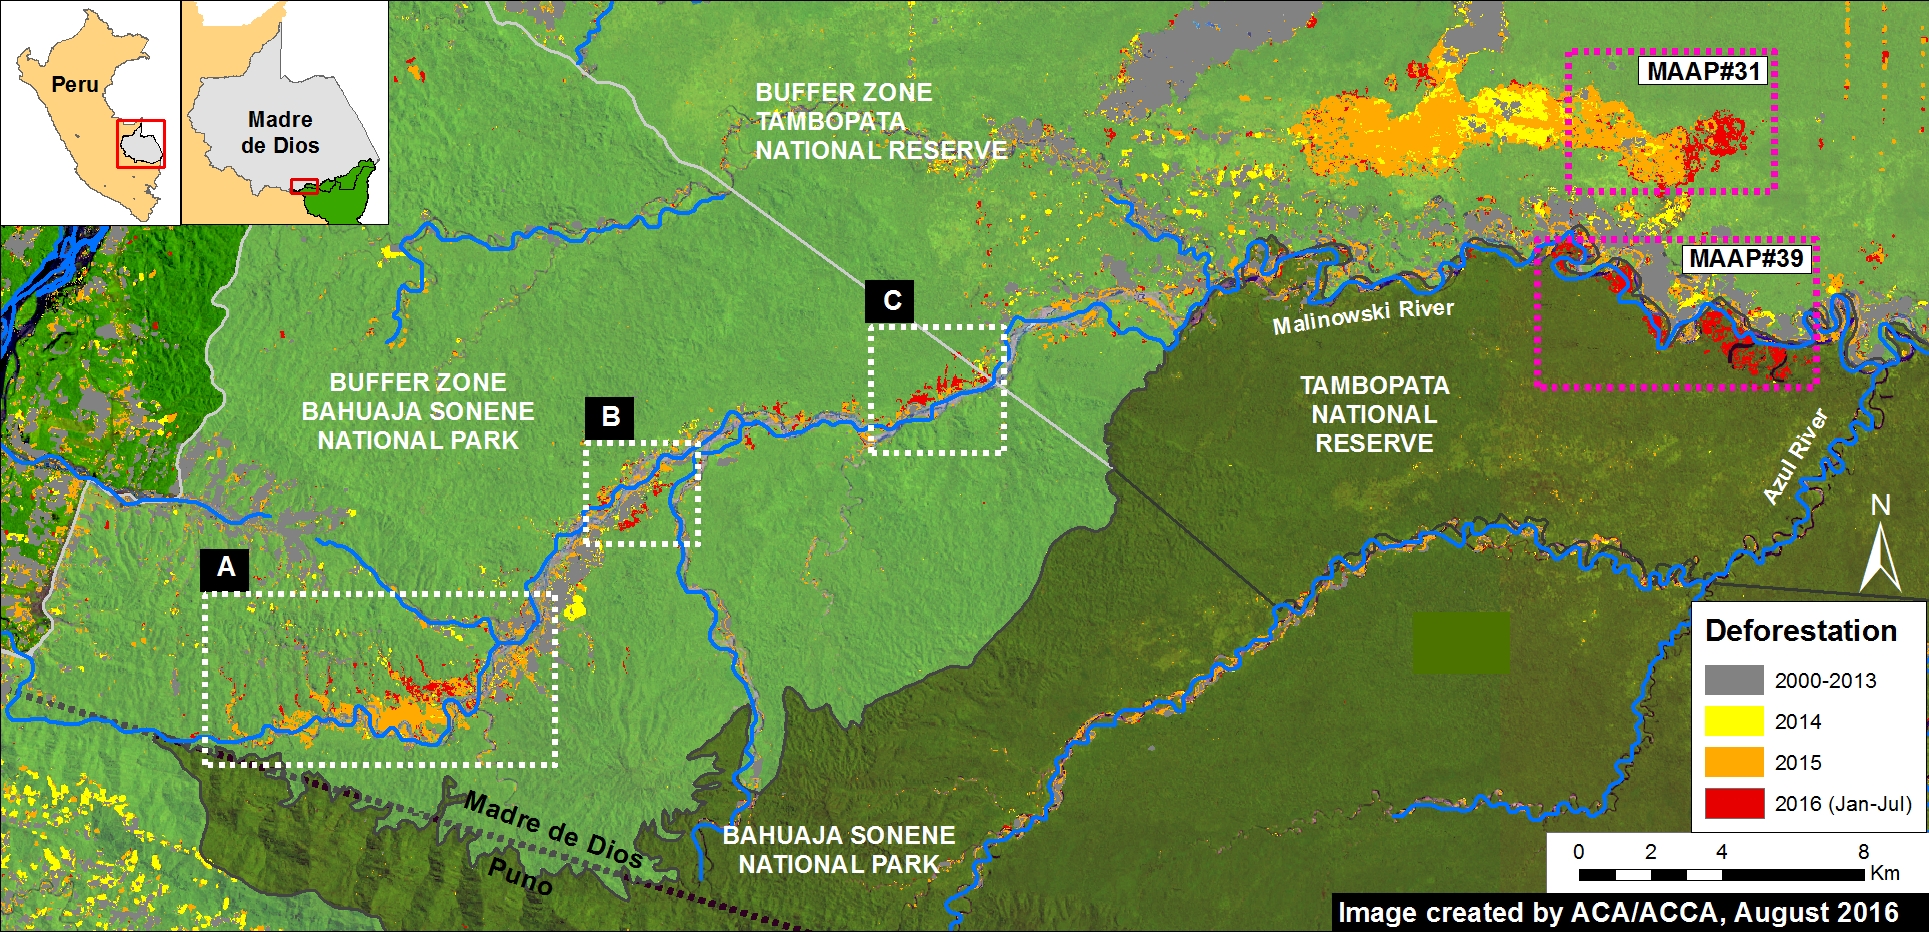
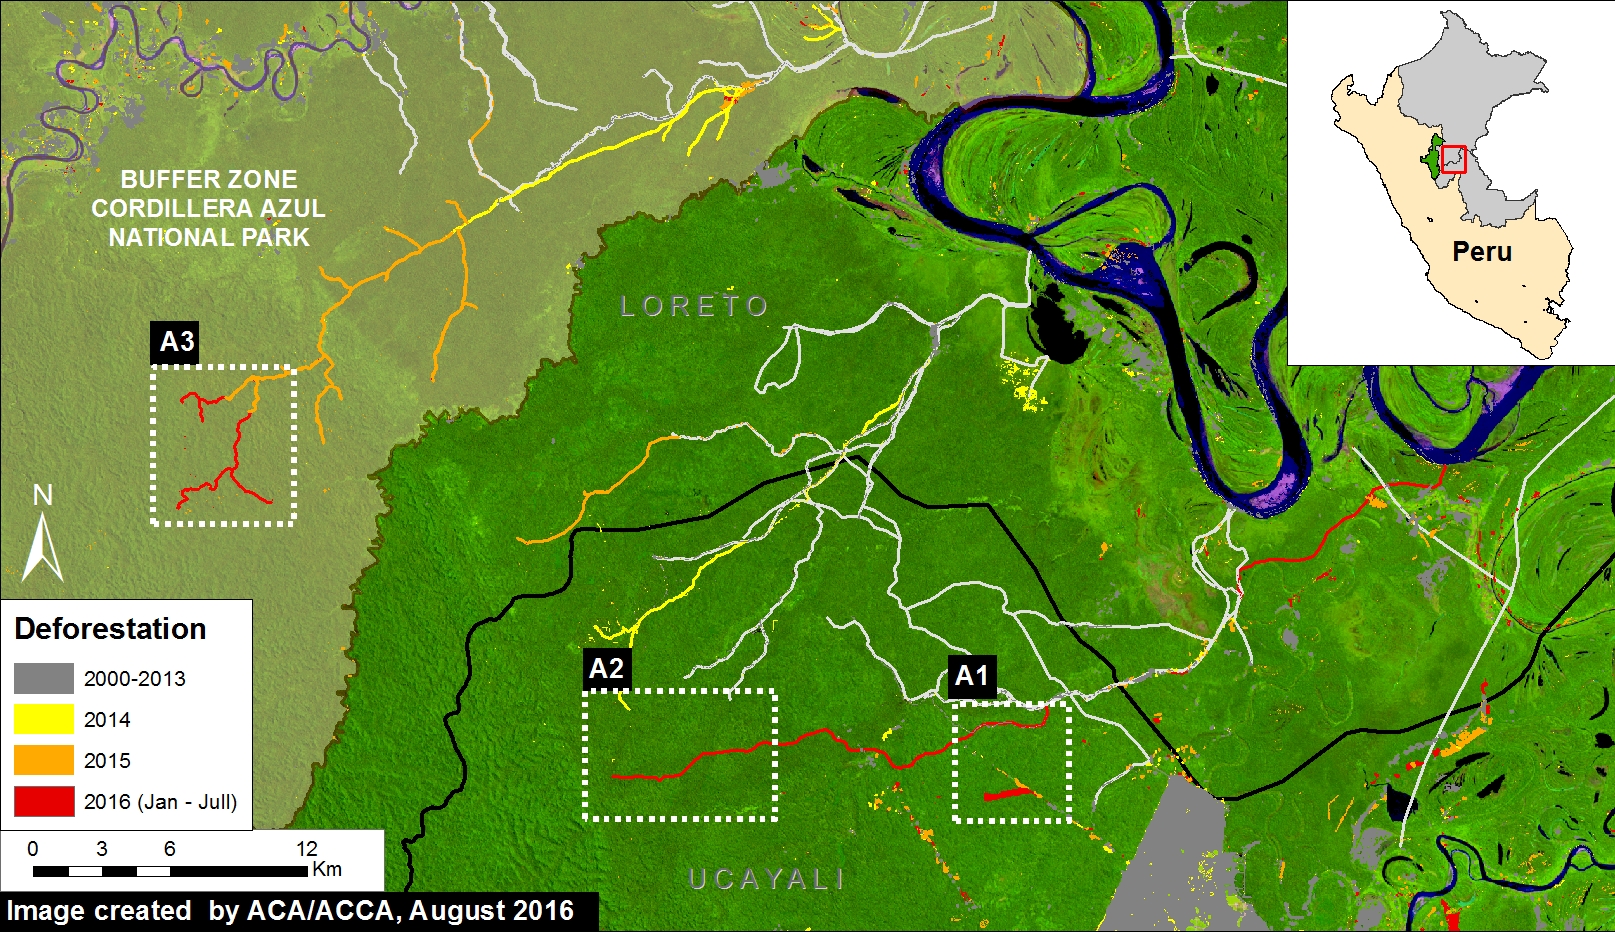
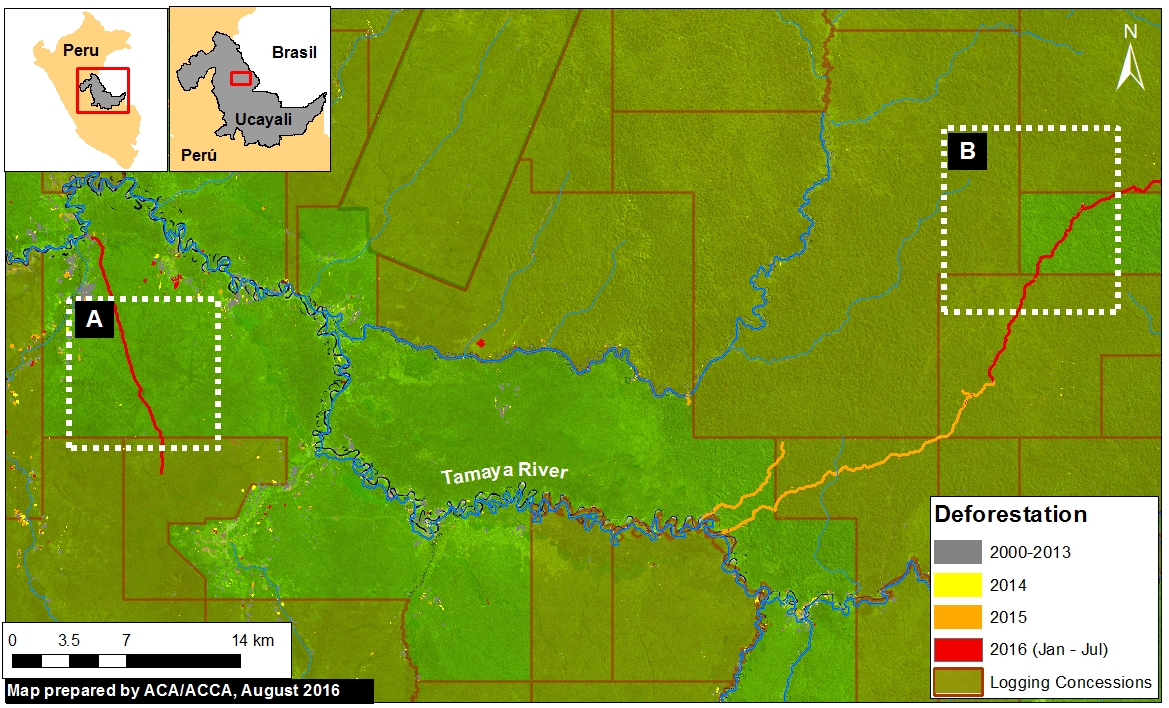
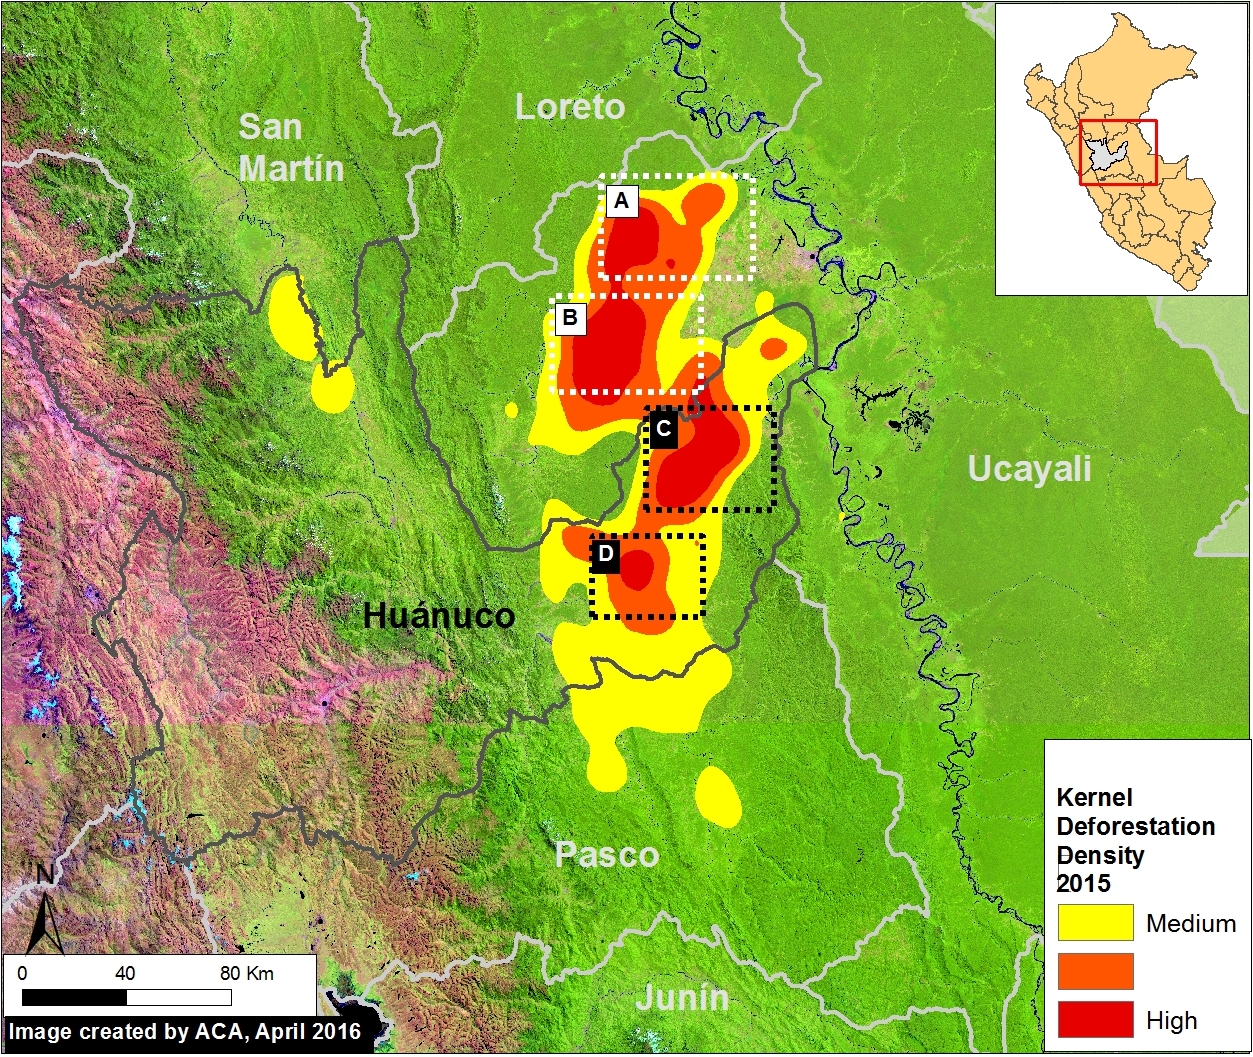
In the previous MAAP #26, we presented a map of Deforestation Hotspots in the Peruvian Amazon during 2015*. This analysis showed that the highest concentration of deforestation is in the central Peruvian Amazon.

Here in MAAP #37, we focus on this region, as indicated by Image 37a. Specifically, we analyze the hotspots shown in Insets C and D, located in the eastern section of the department of Huanuco.

(Note that we previously described the hotspots indicated by Insets A and B, located in northwest Ucayali department, in MAAP #26).

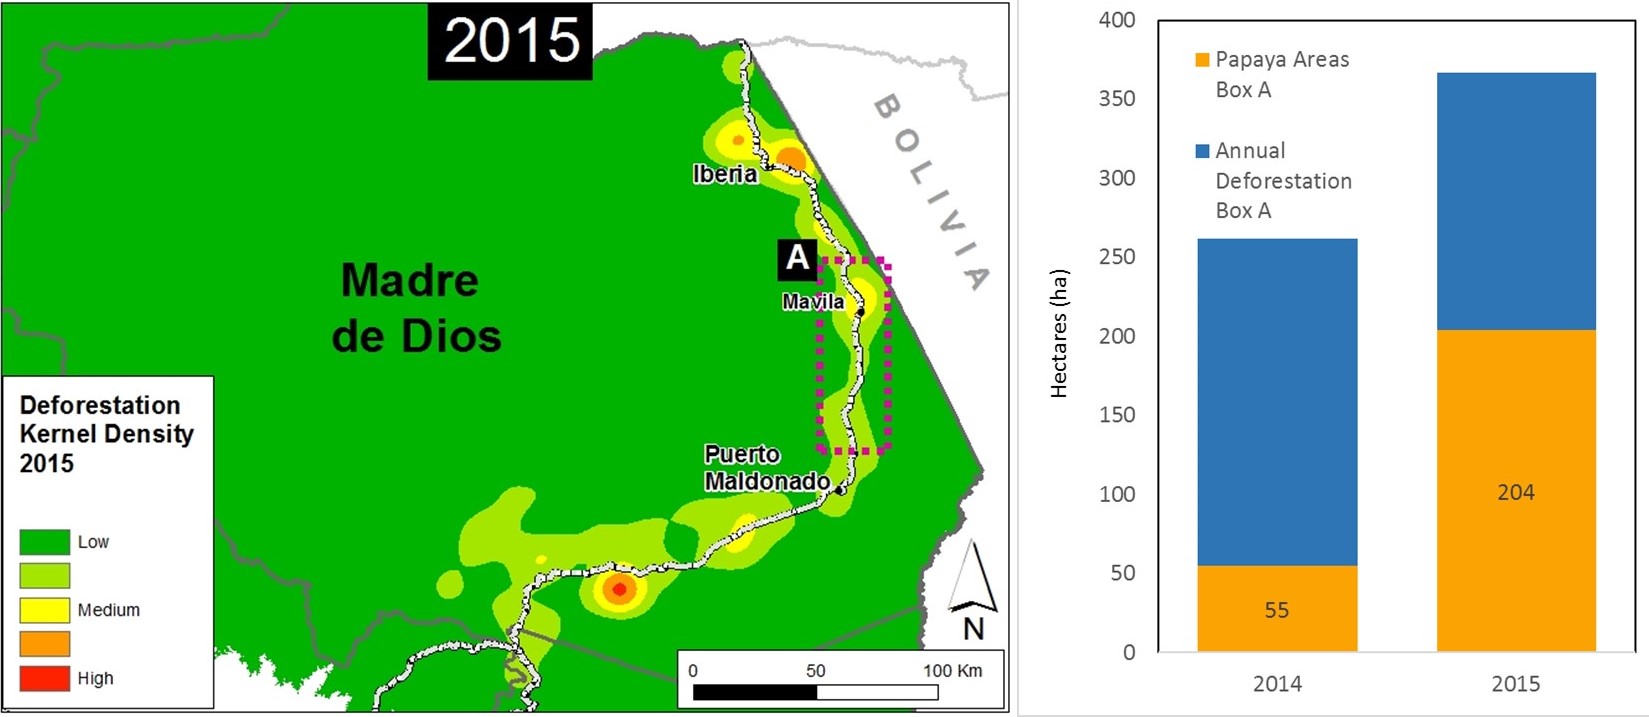
For 2015, we calculated a total deforestation of 7,930 hectares (19,595 acres) in the area indicated by these two insets. The main deforestation driver is likely cattle pasture (see below). It is worth noting that the vast majority of the deforested area (87%) is outside of areas zoned for agriculture use.

We calculated an additional deforestation of 16,590 hectares (41,000 acres) in 2013 and 2014. Again, the vast majority of the forest loss appears to be outside areas zoned for agriculture use.


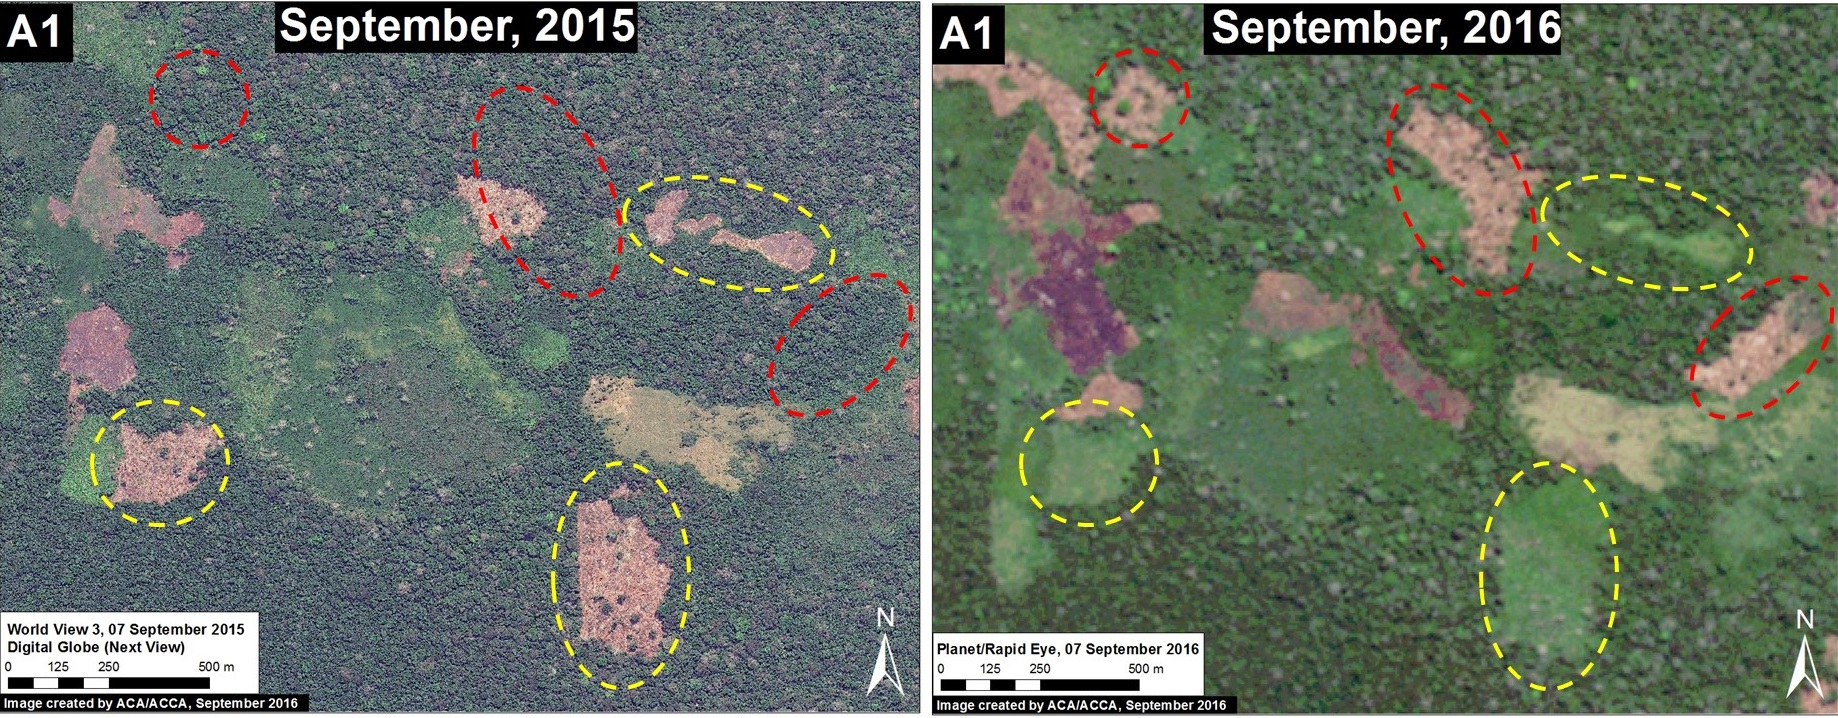
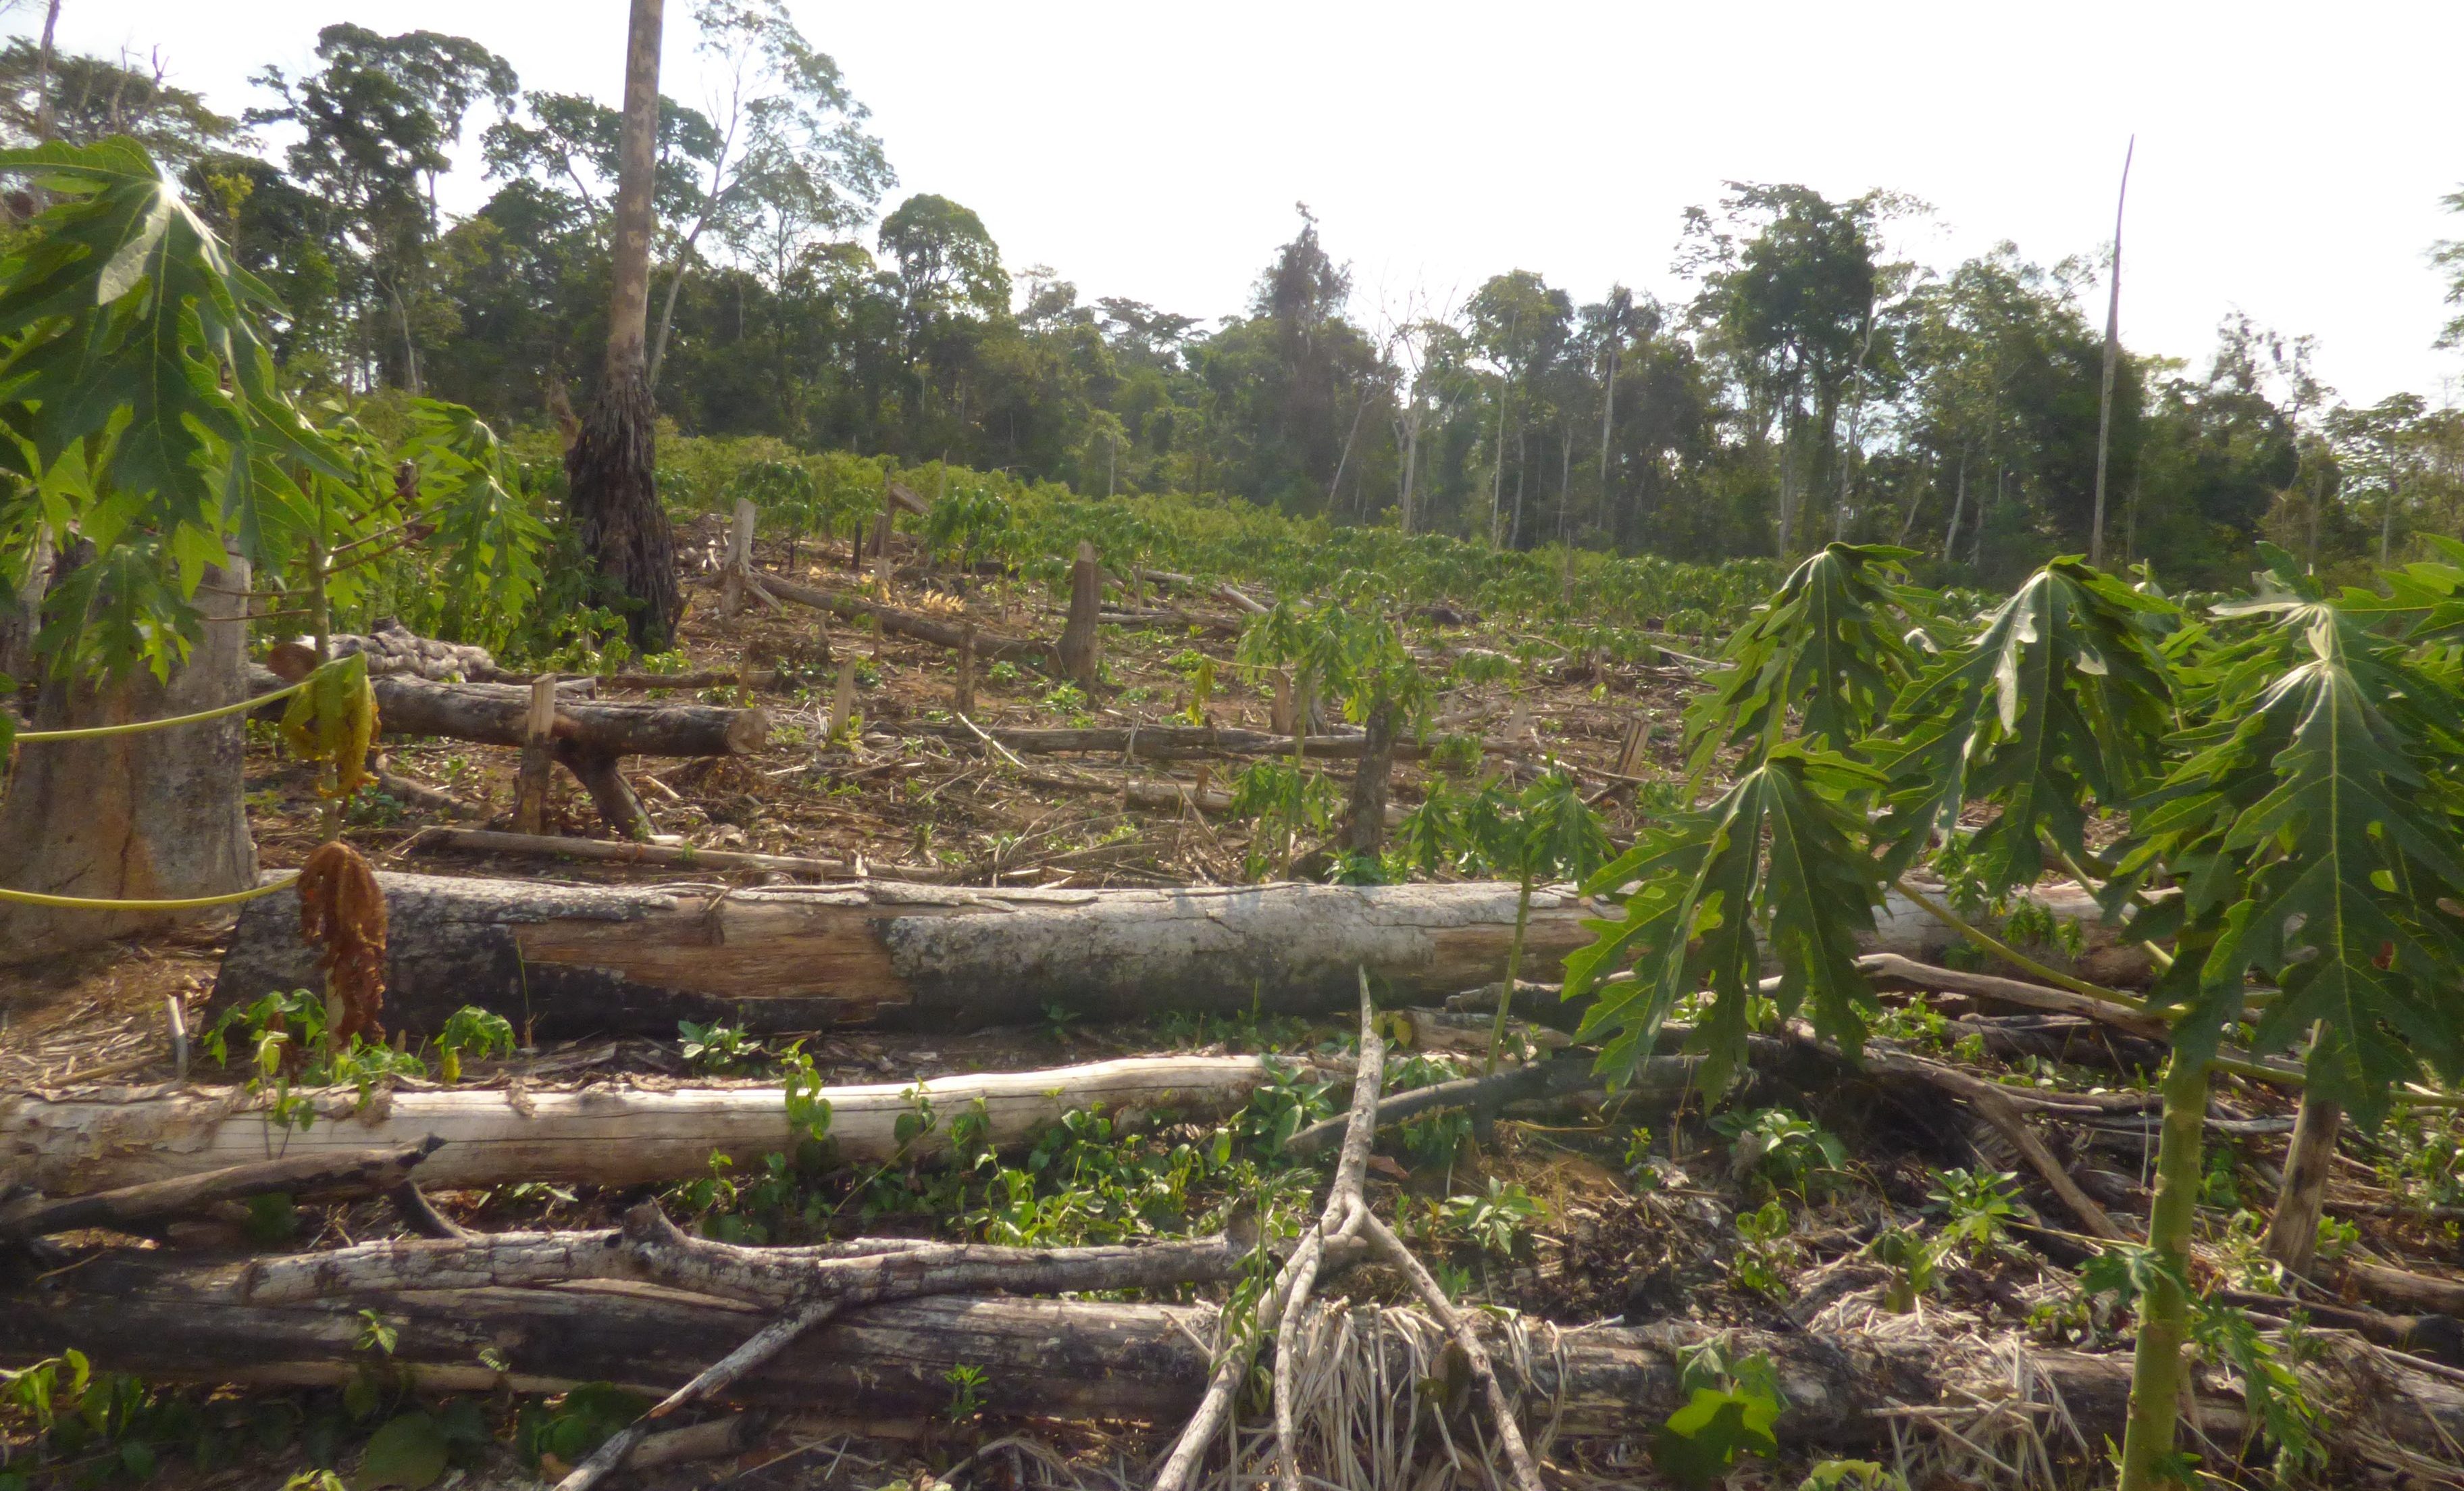
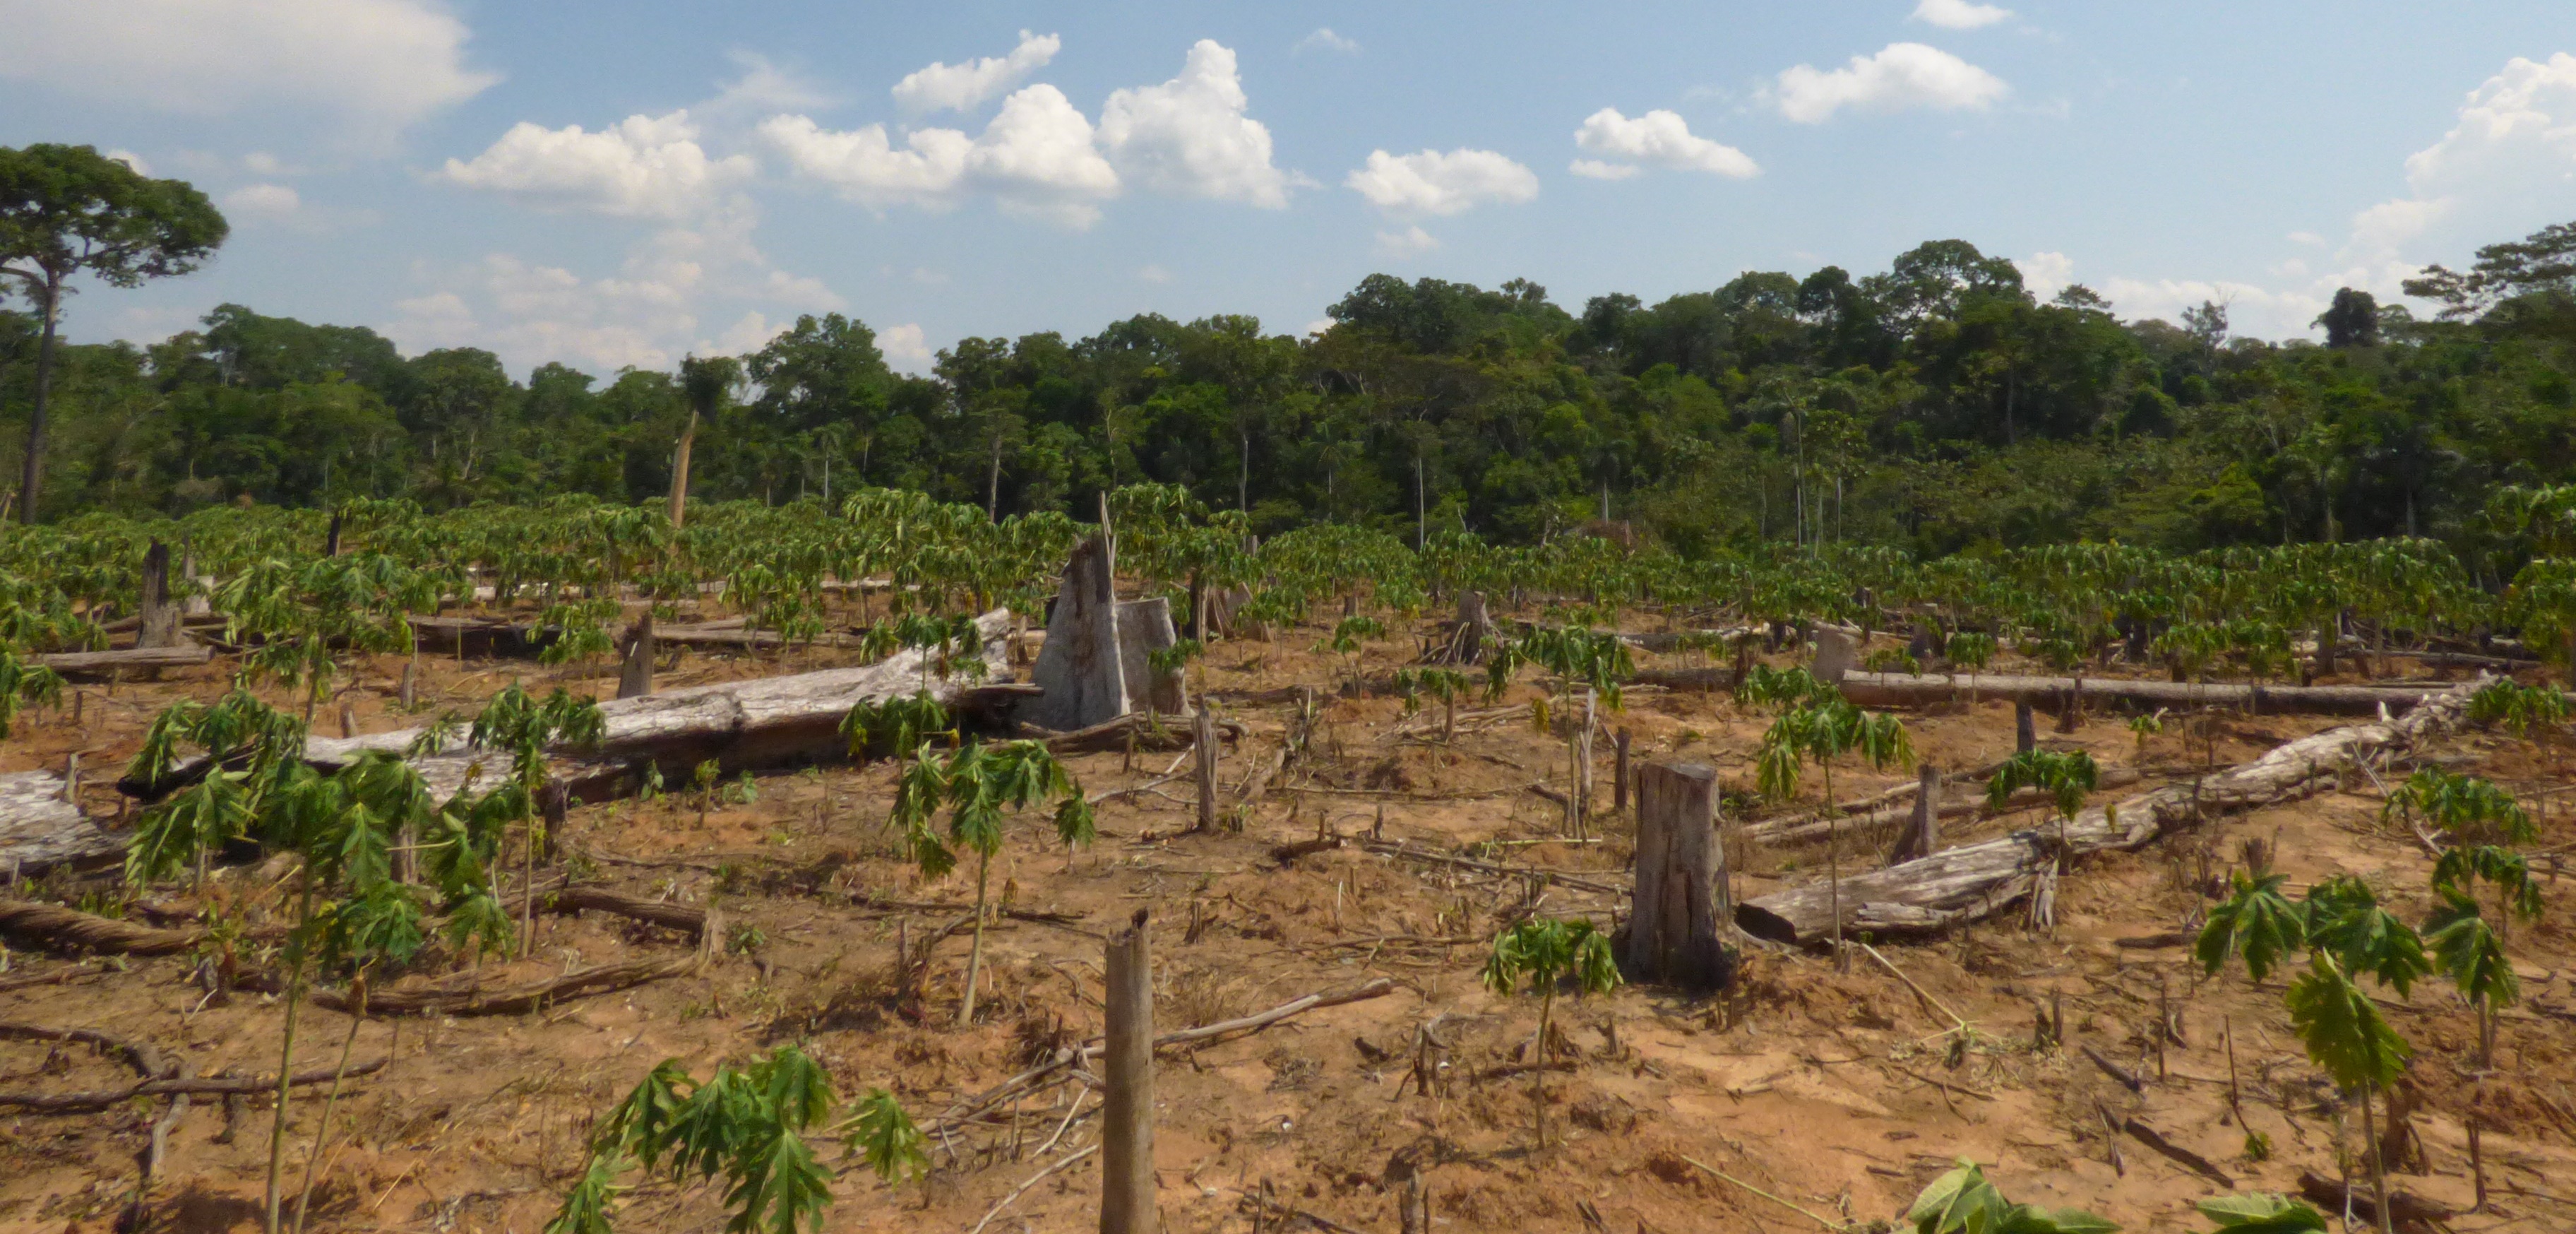
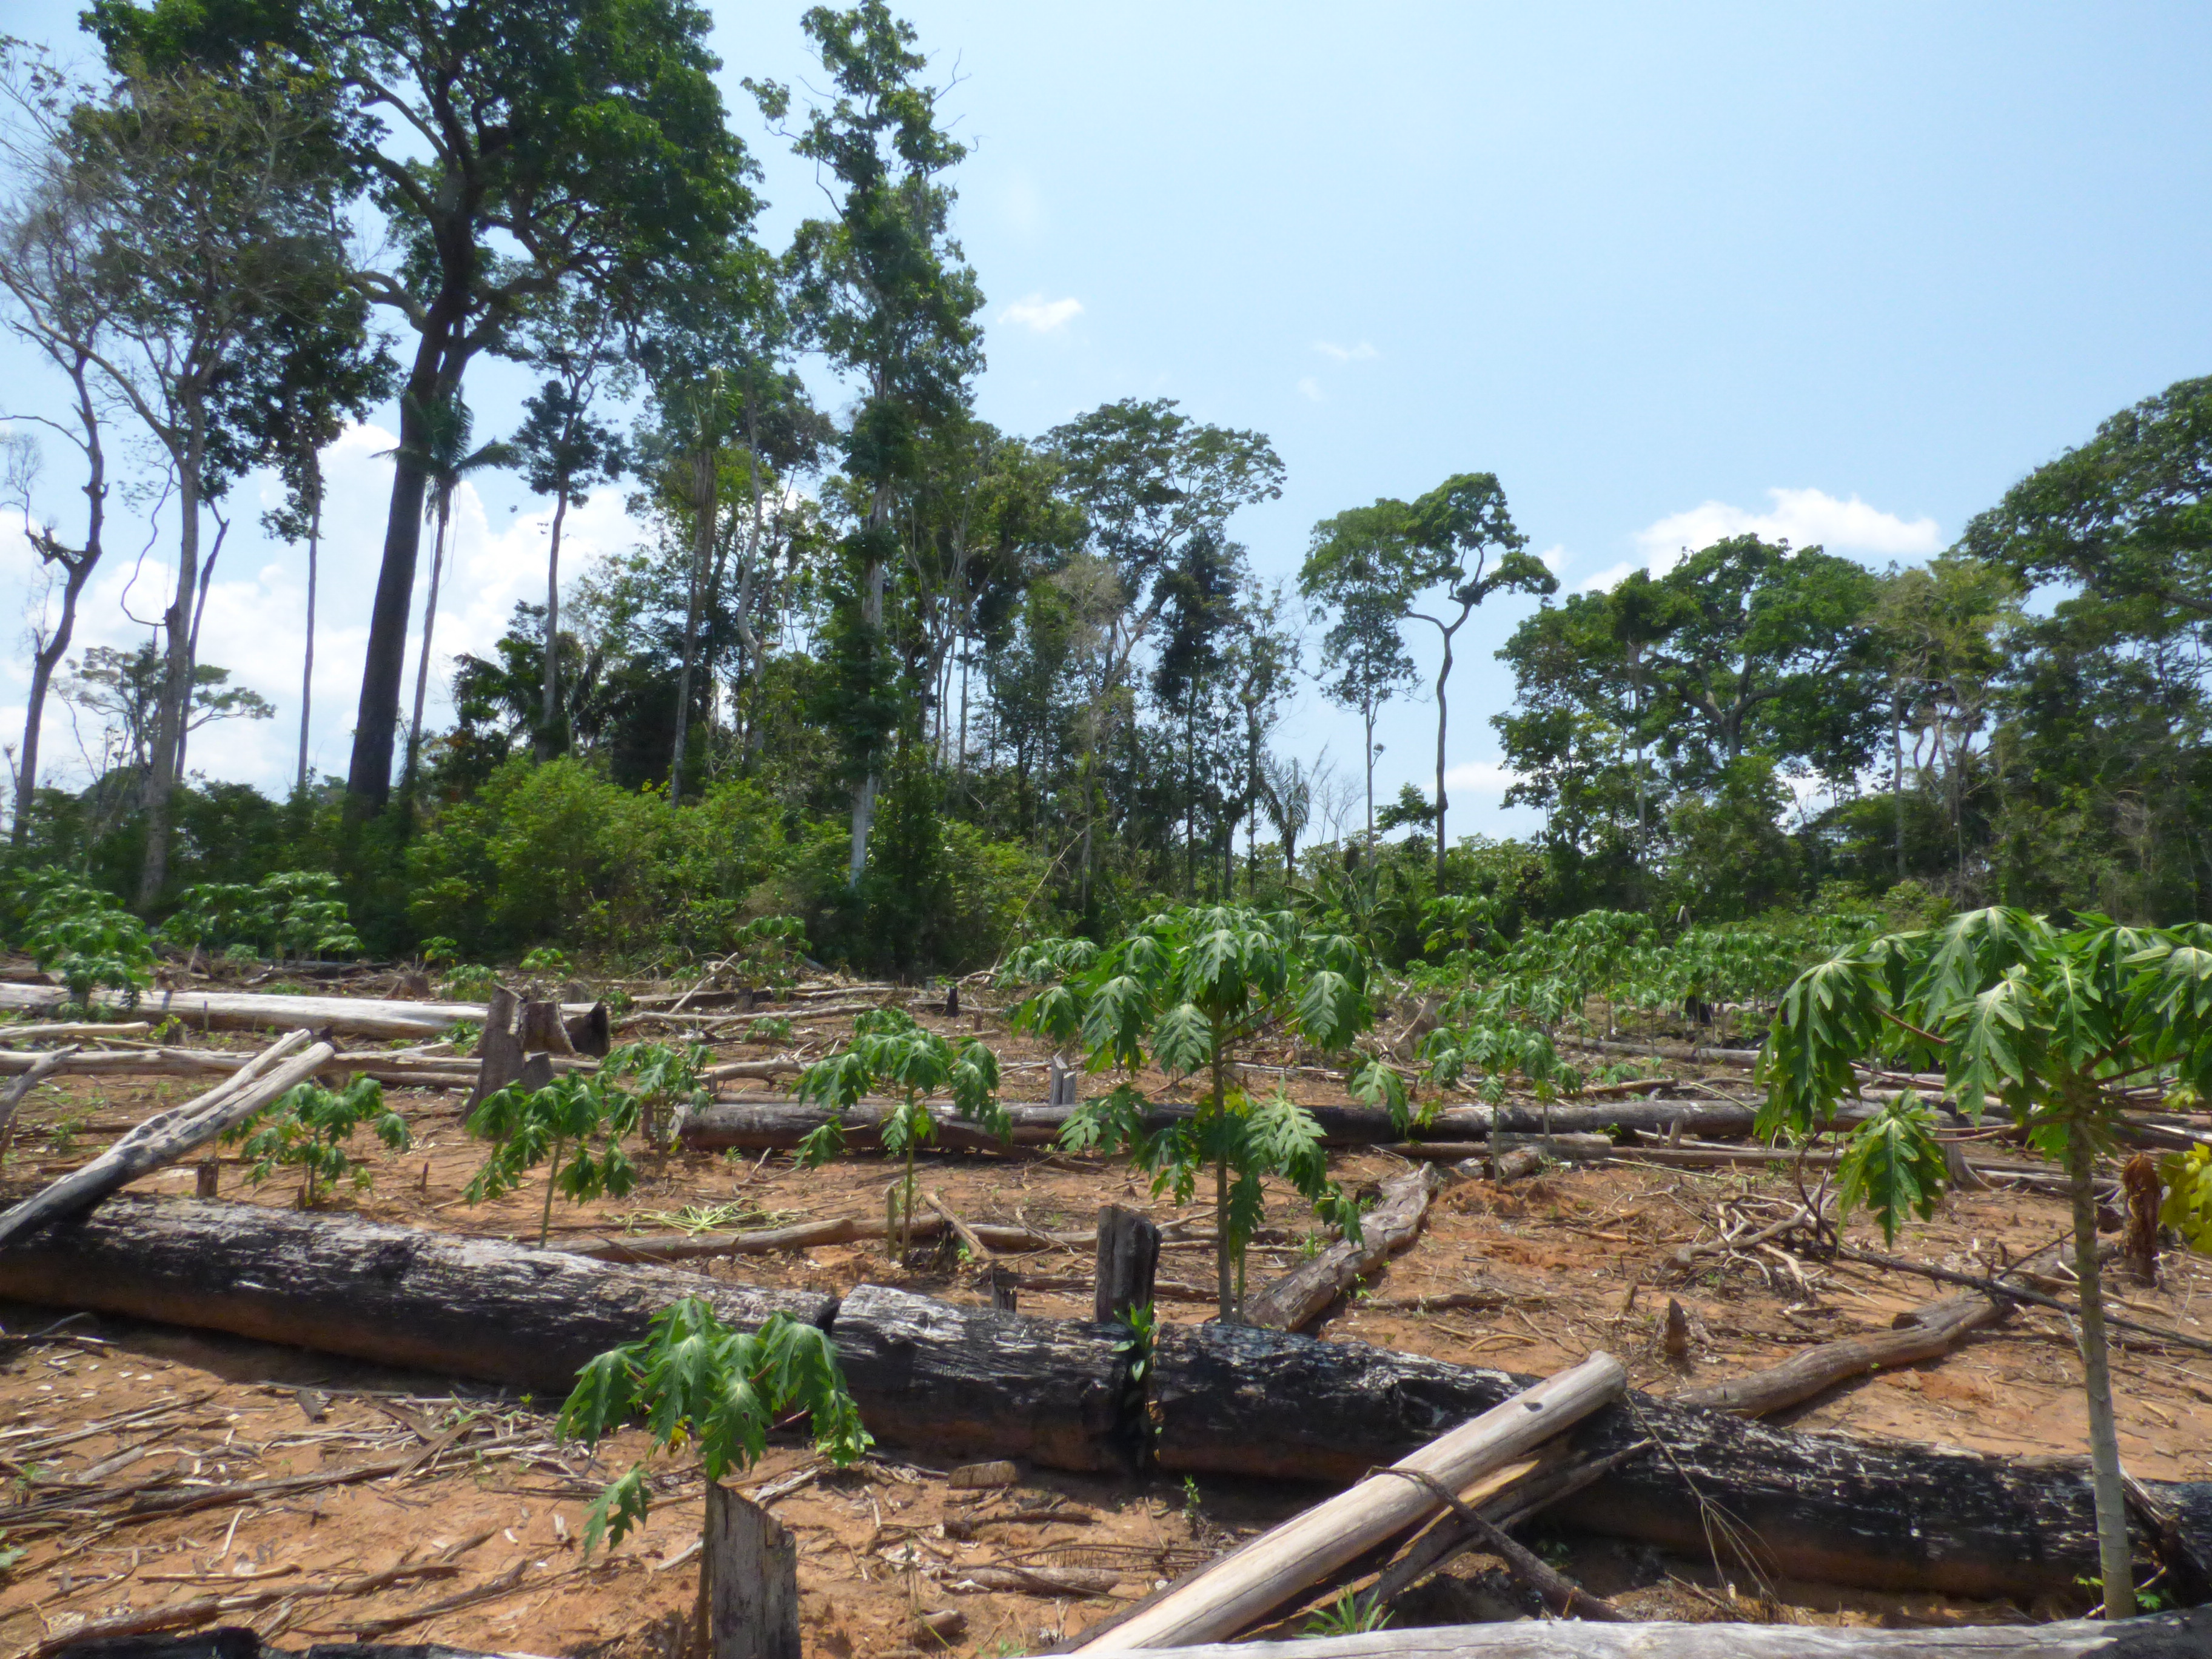
Deforestation Driver: Cattle Pasture

The predominant land use in the area is cattle pasture, so that is likely the leading driver of the documented deforestation.

We took a sample (1,500 hectares) of areas that were deforested in 2014, and found that 76% (1,140 hectares) were converted to cattle pasture in 2015. All sample areas were greater than 5 hectares and had available high-resolution imagery from September 2015. Based on an analysis of the imagery, we estimate that a similar amount of area was being cleared for pasture in 2015.

Below, we show a series of high-resolution images of this deforestation (click each image to enlarge).
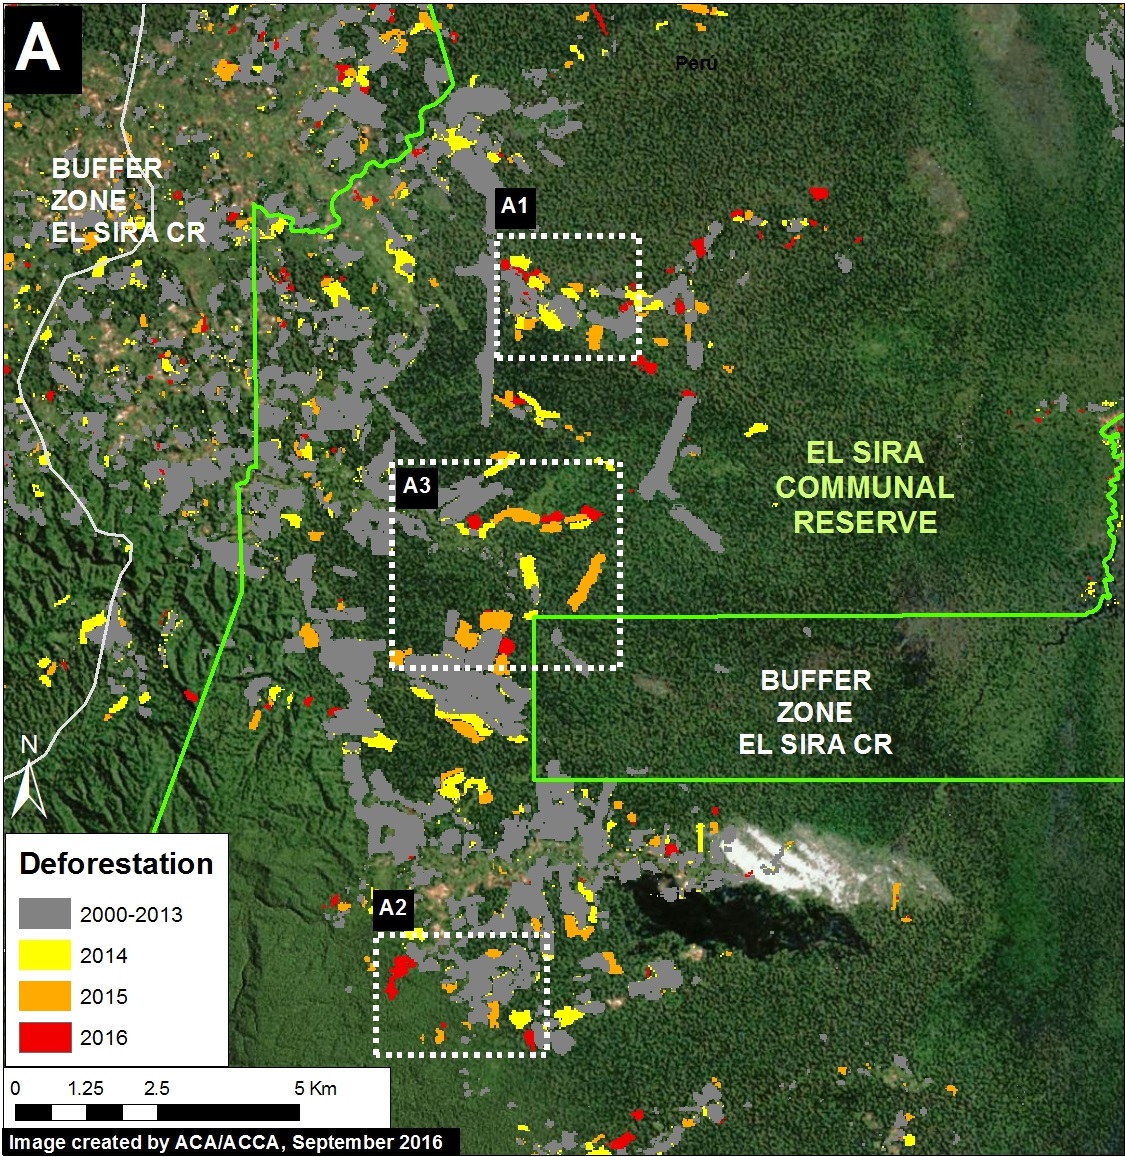
Inset C Hotspot

Huanuco_zoomC_v5
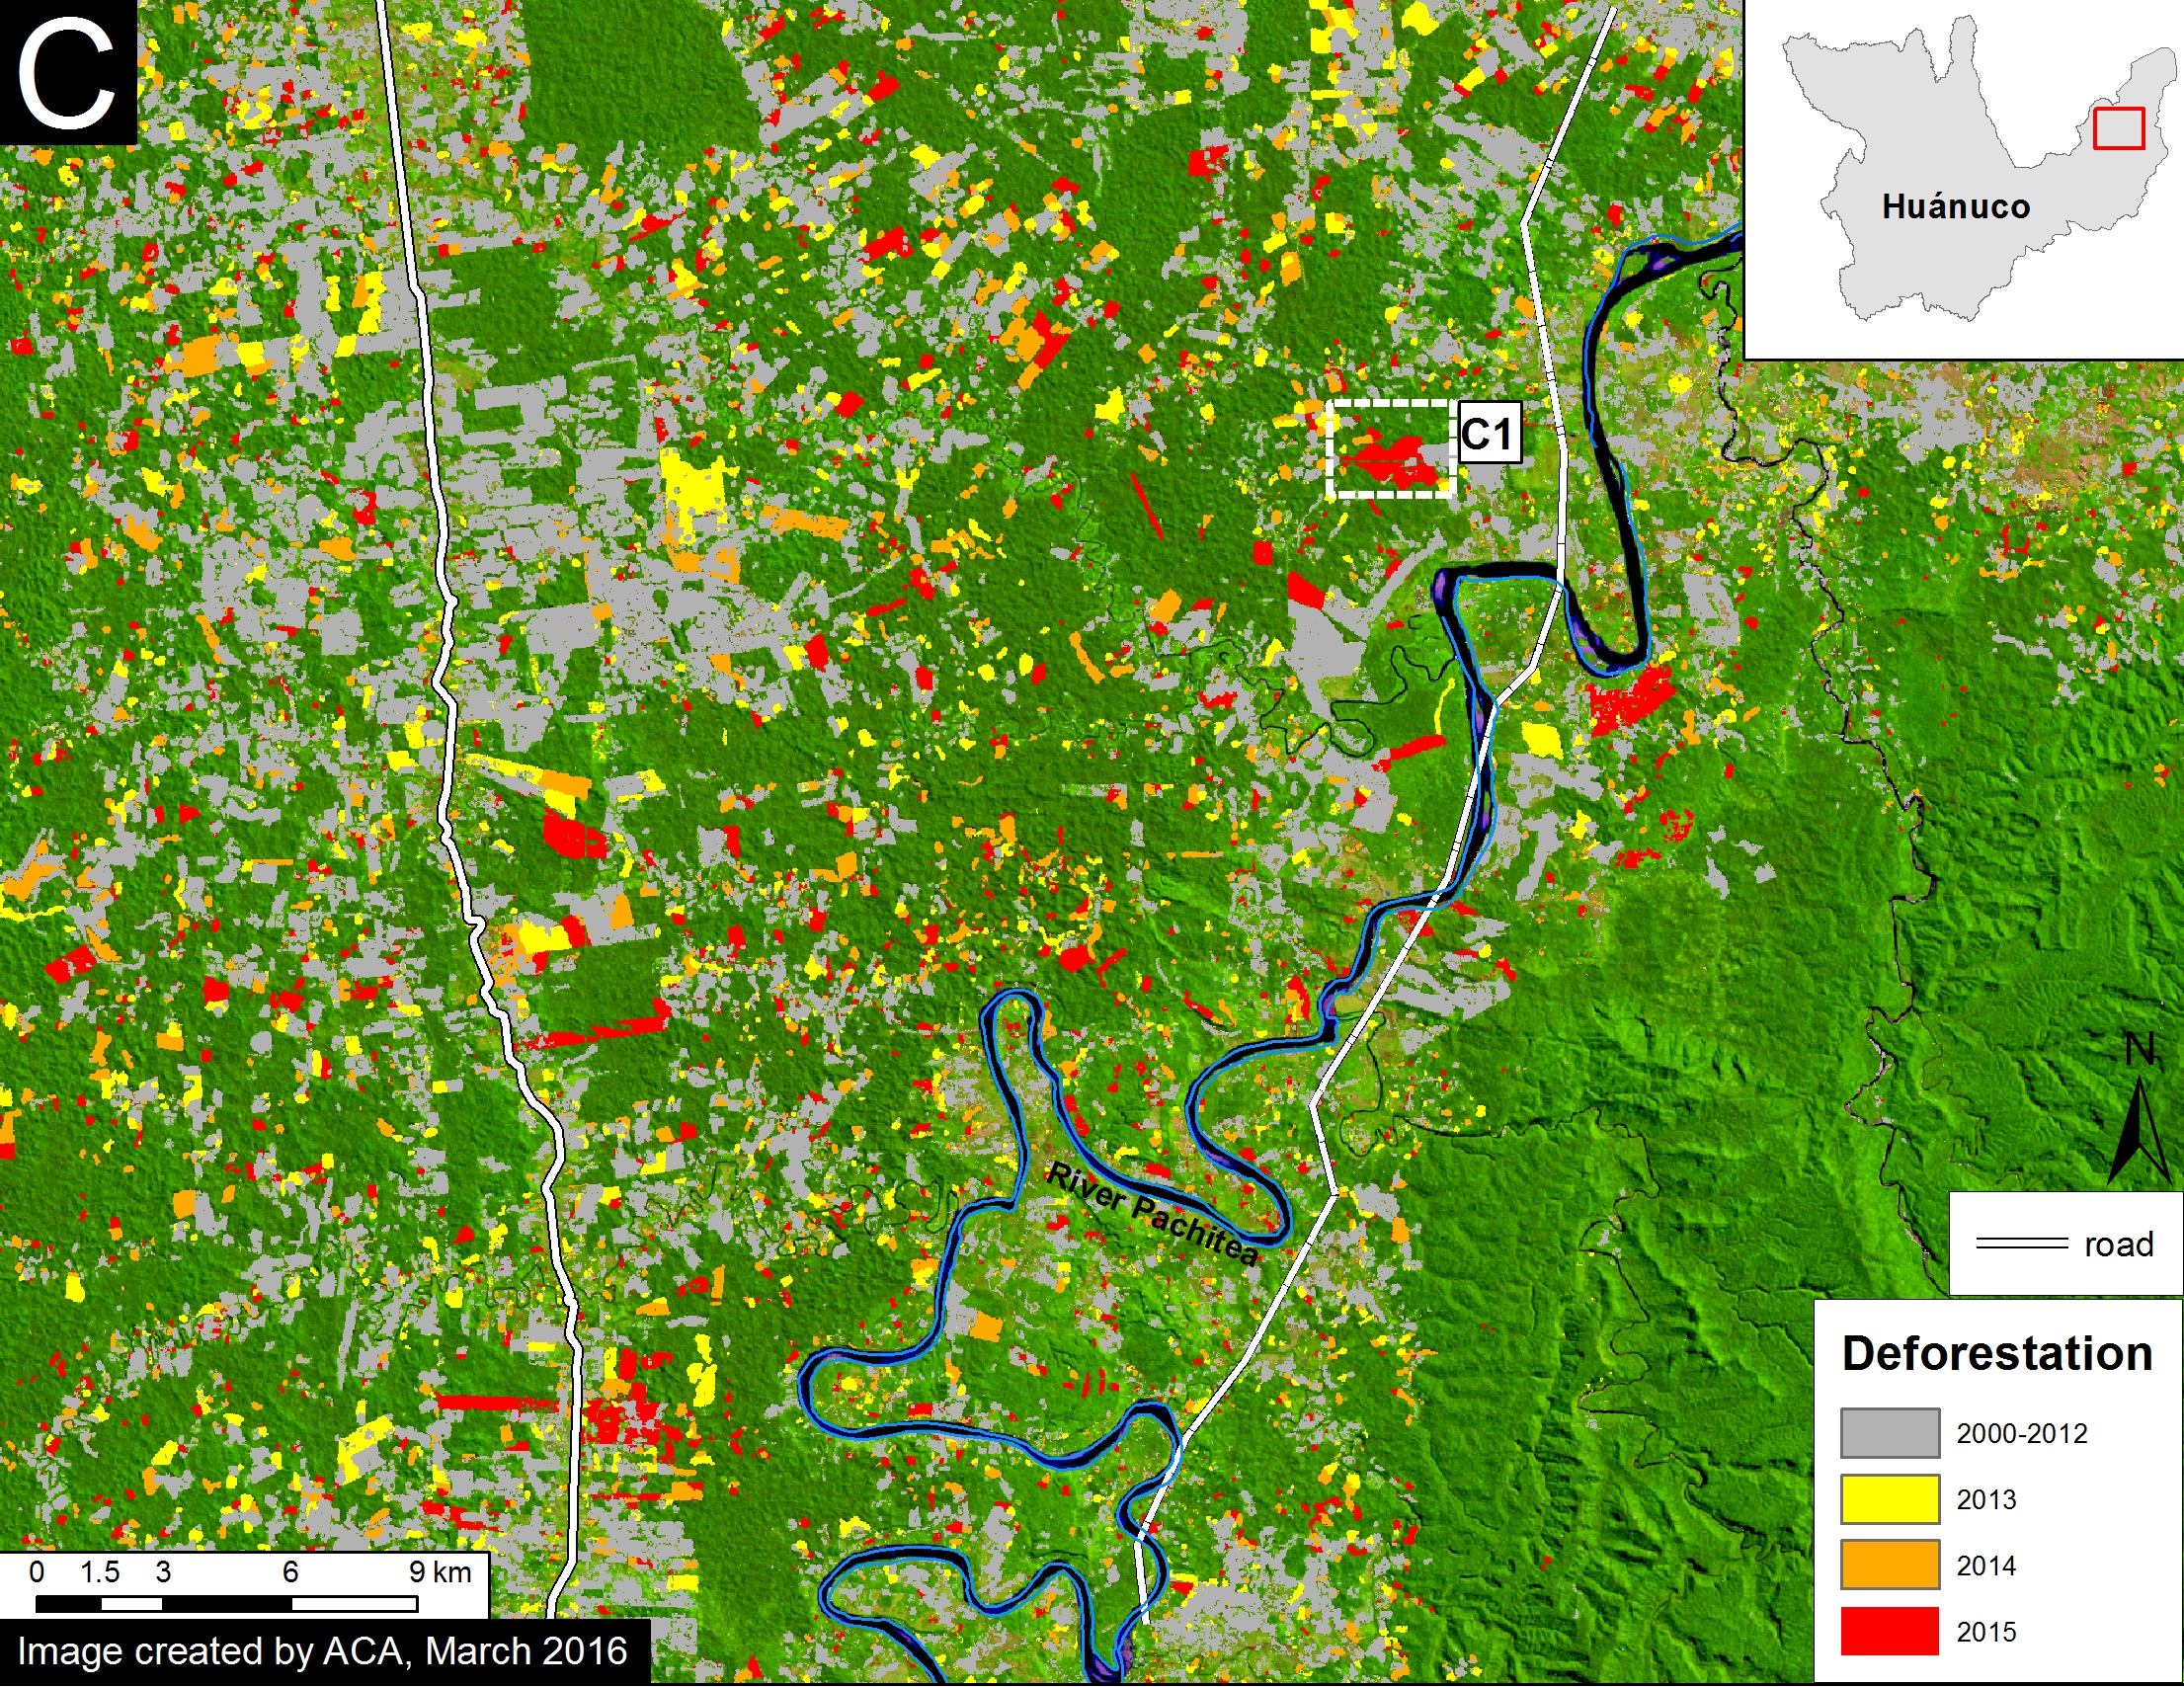
Image 37b. Data: PNCB/MINAM, UMD/GLAD, MTC

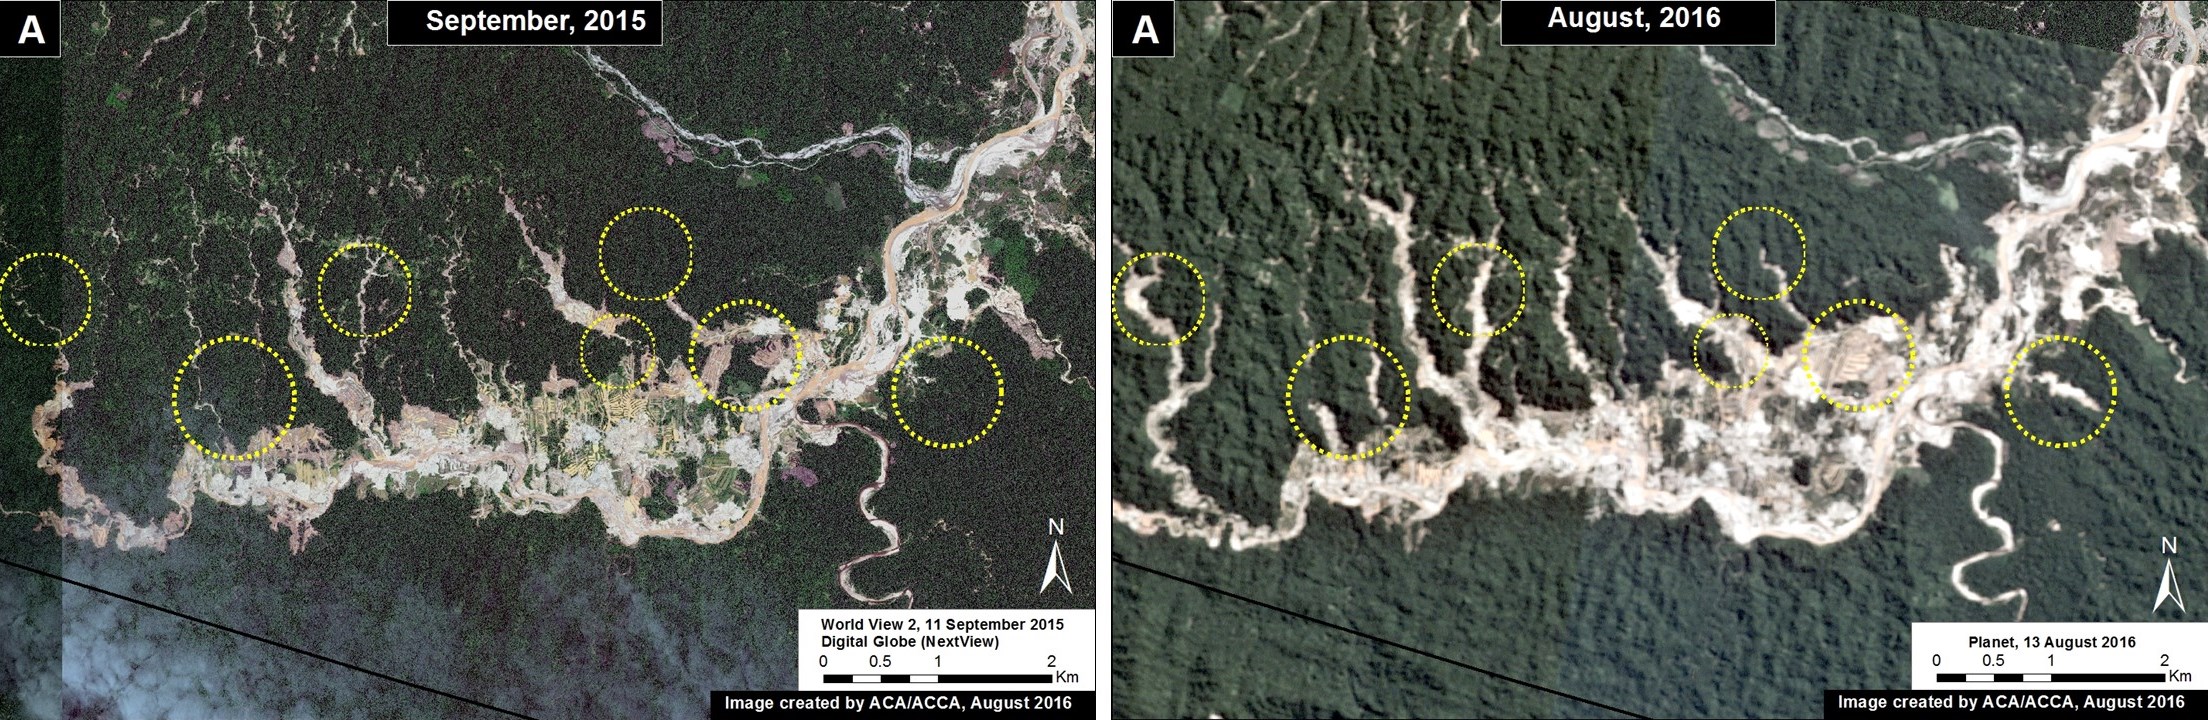
Image 37b shows a detailed view of the deforestation inside the area indicated by Inset C.

In this area, we documented deforestation of 5,050 hectares in 2015. Of this total, 46% of the deforestation events were small-scale (<5 ha), 43% were medium-scale (5-50 ha), and 12% were large-scale (>50 ha).

We calculated an additional deforestation 0f 9,940 hectares in 2013 and 2014.

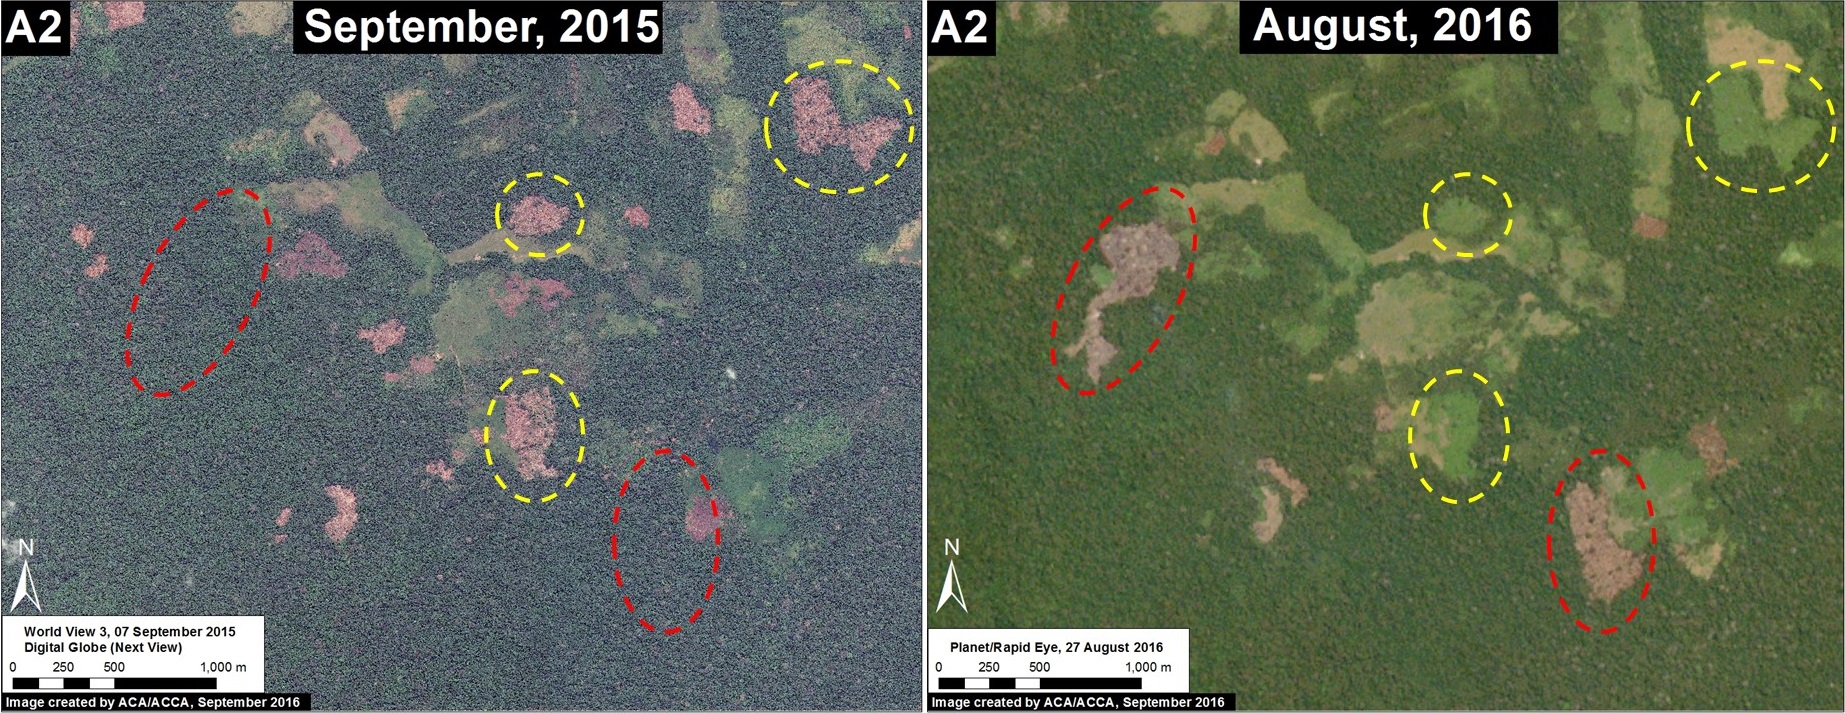
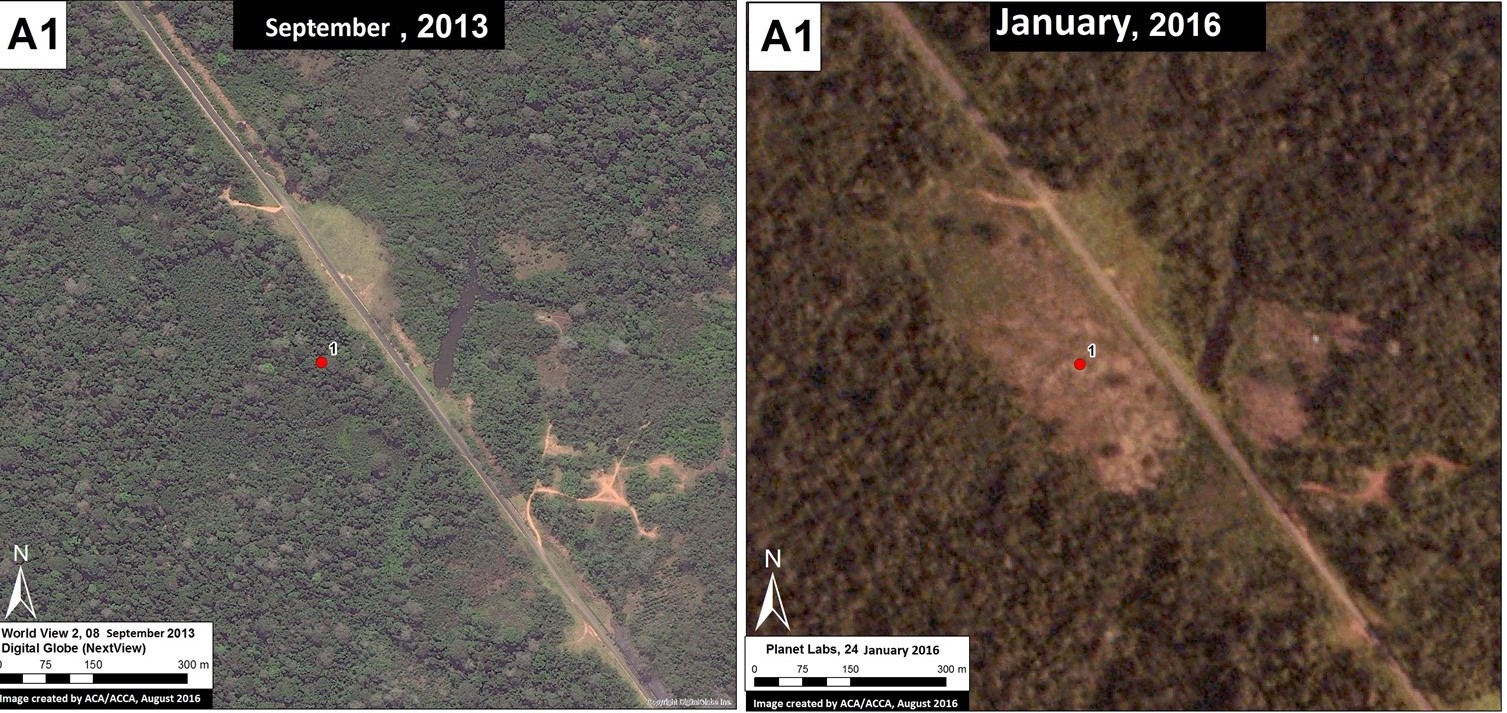
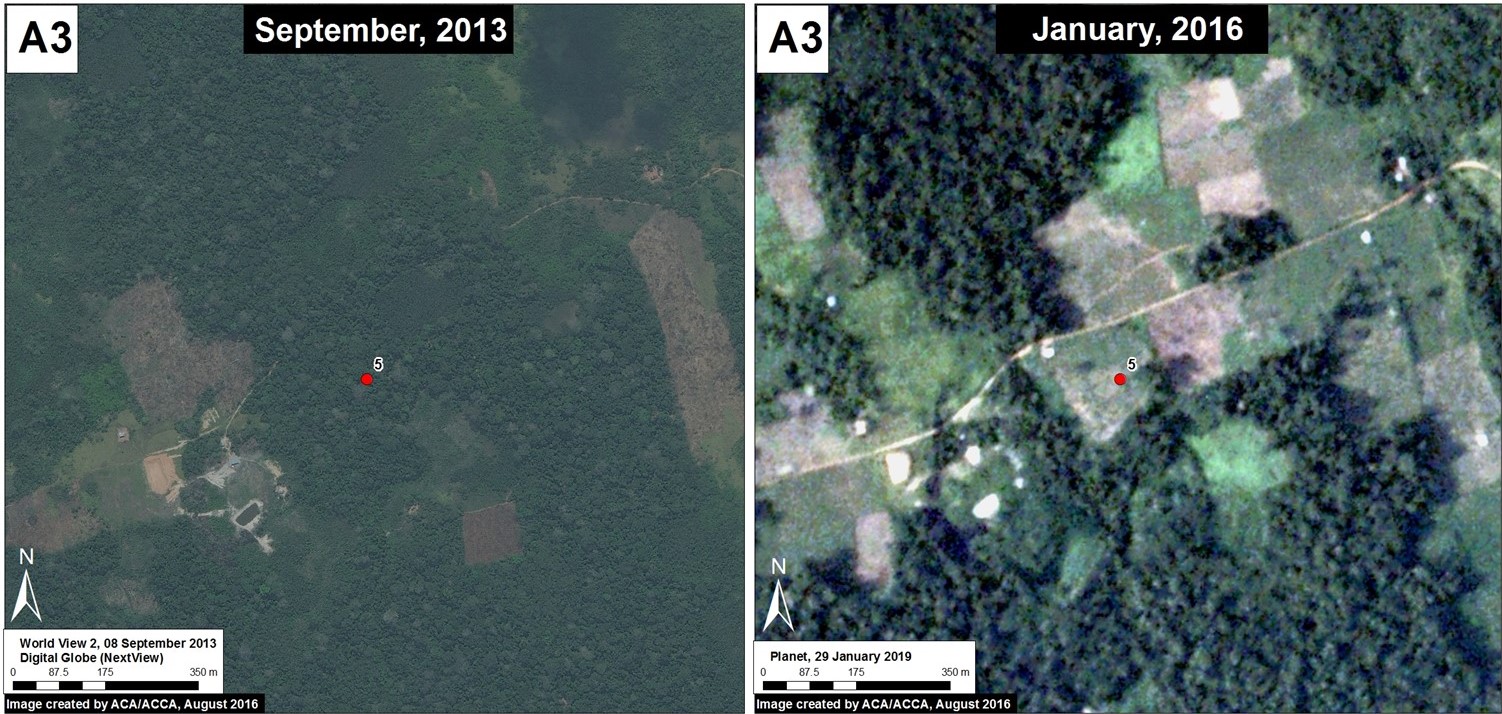
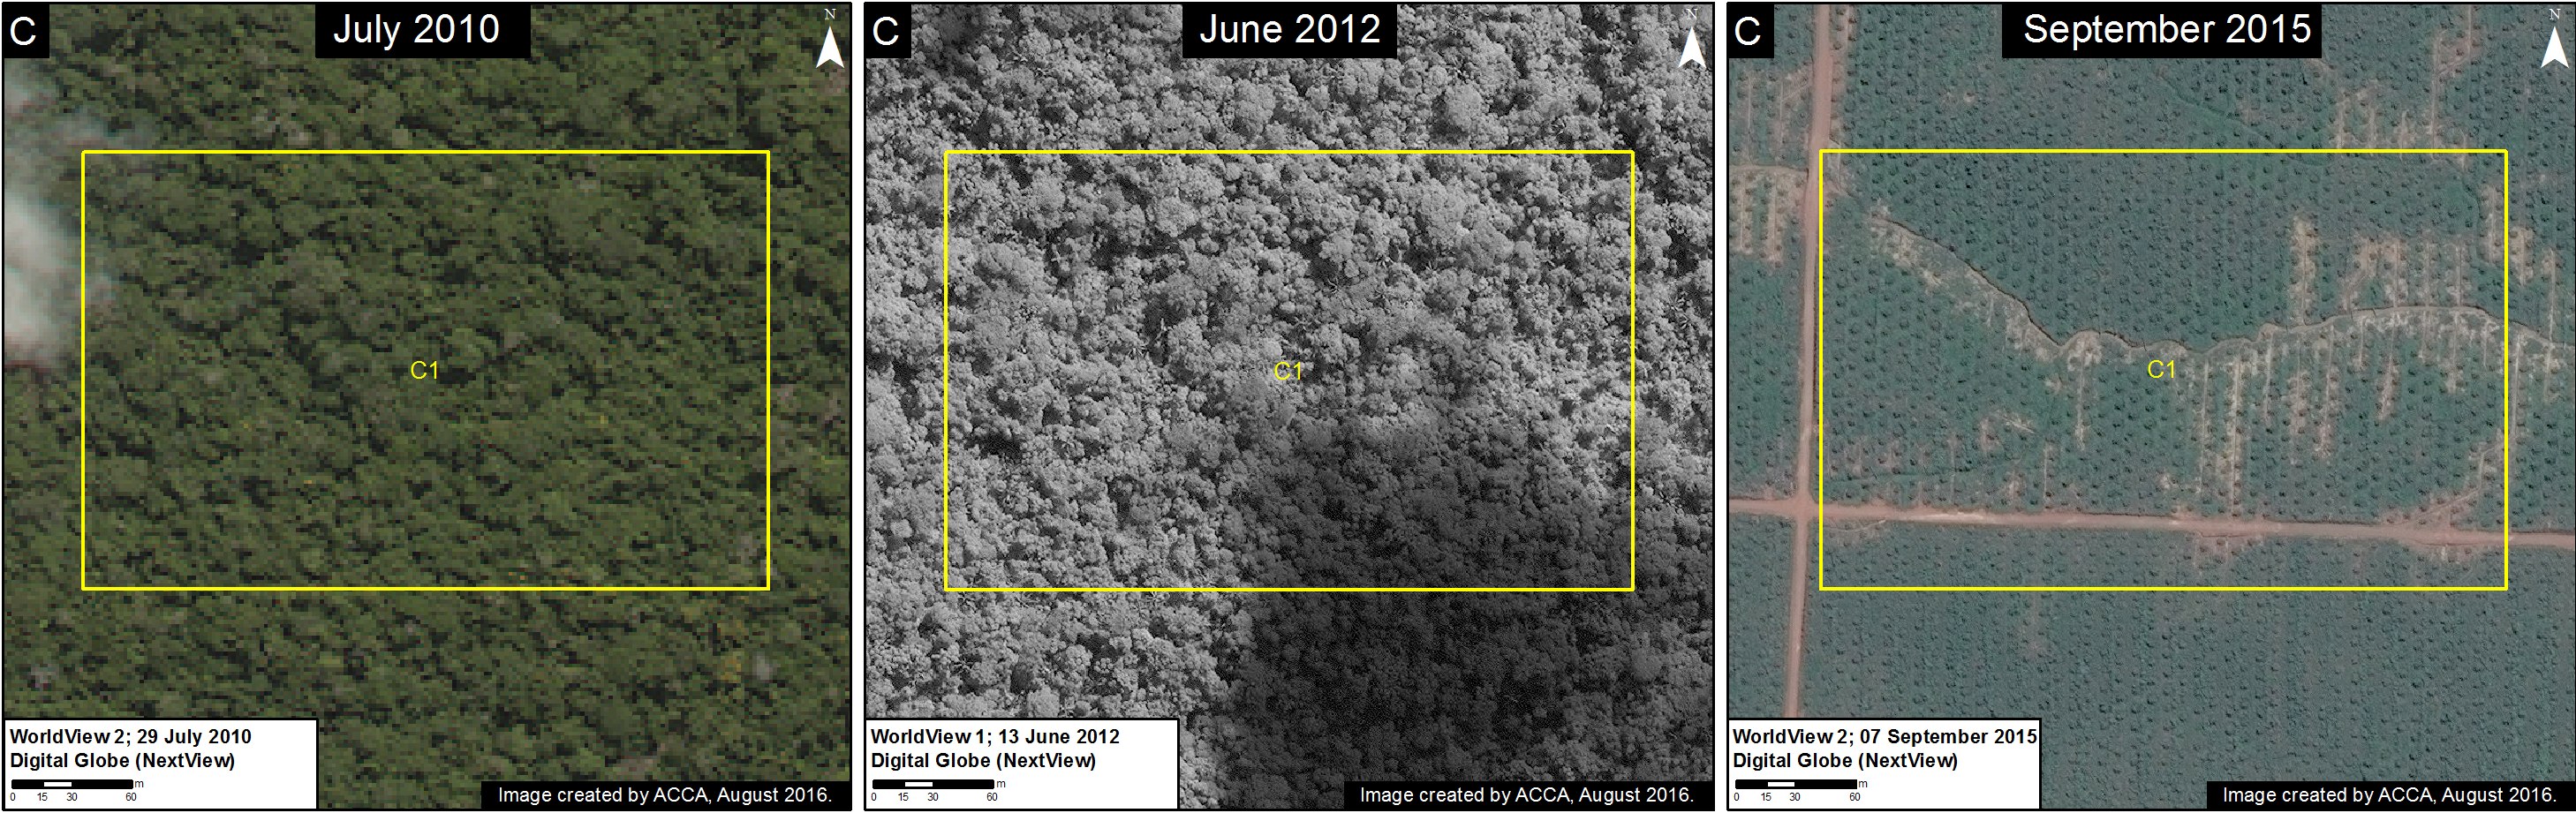
In Image 37c we show, in high resolution, an example of the recent deforestation in this area between August 2014 (left panel) and September 2015 (right panel). See Inset C1 for context.

Huanuco_C1_v5_DG
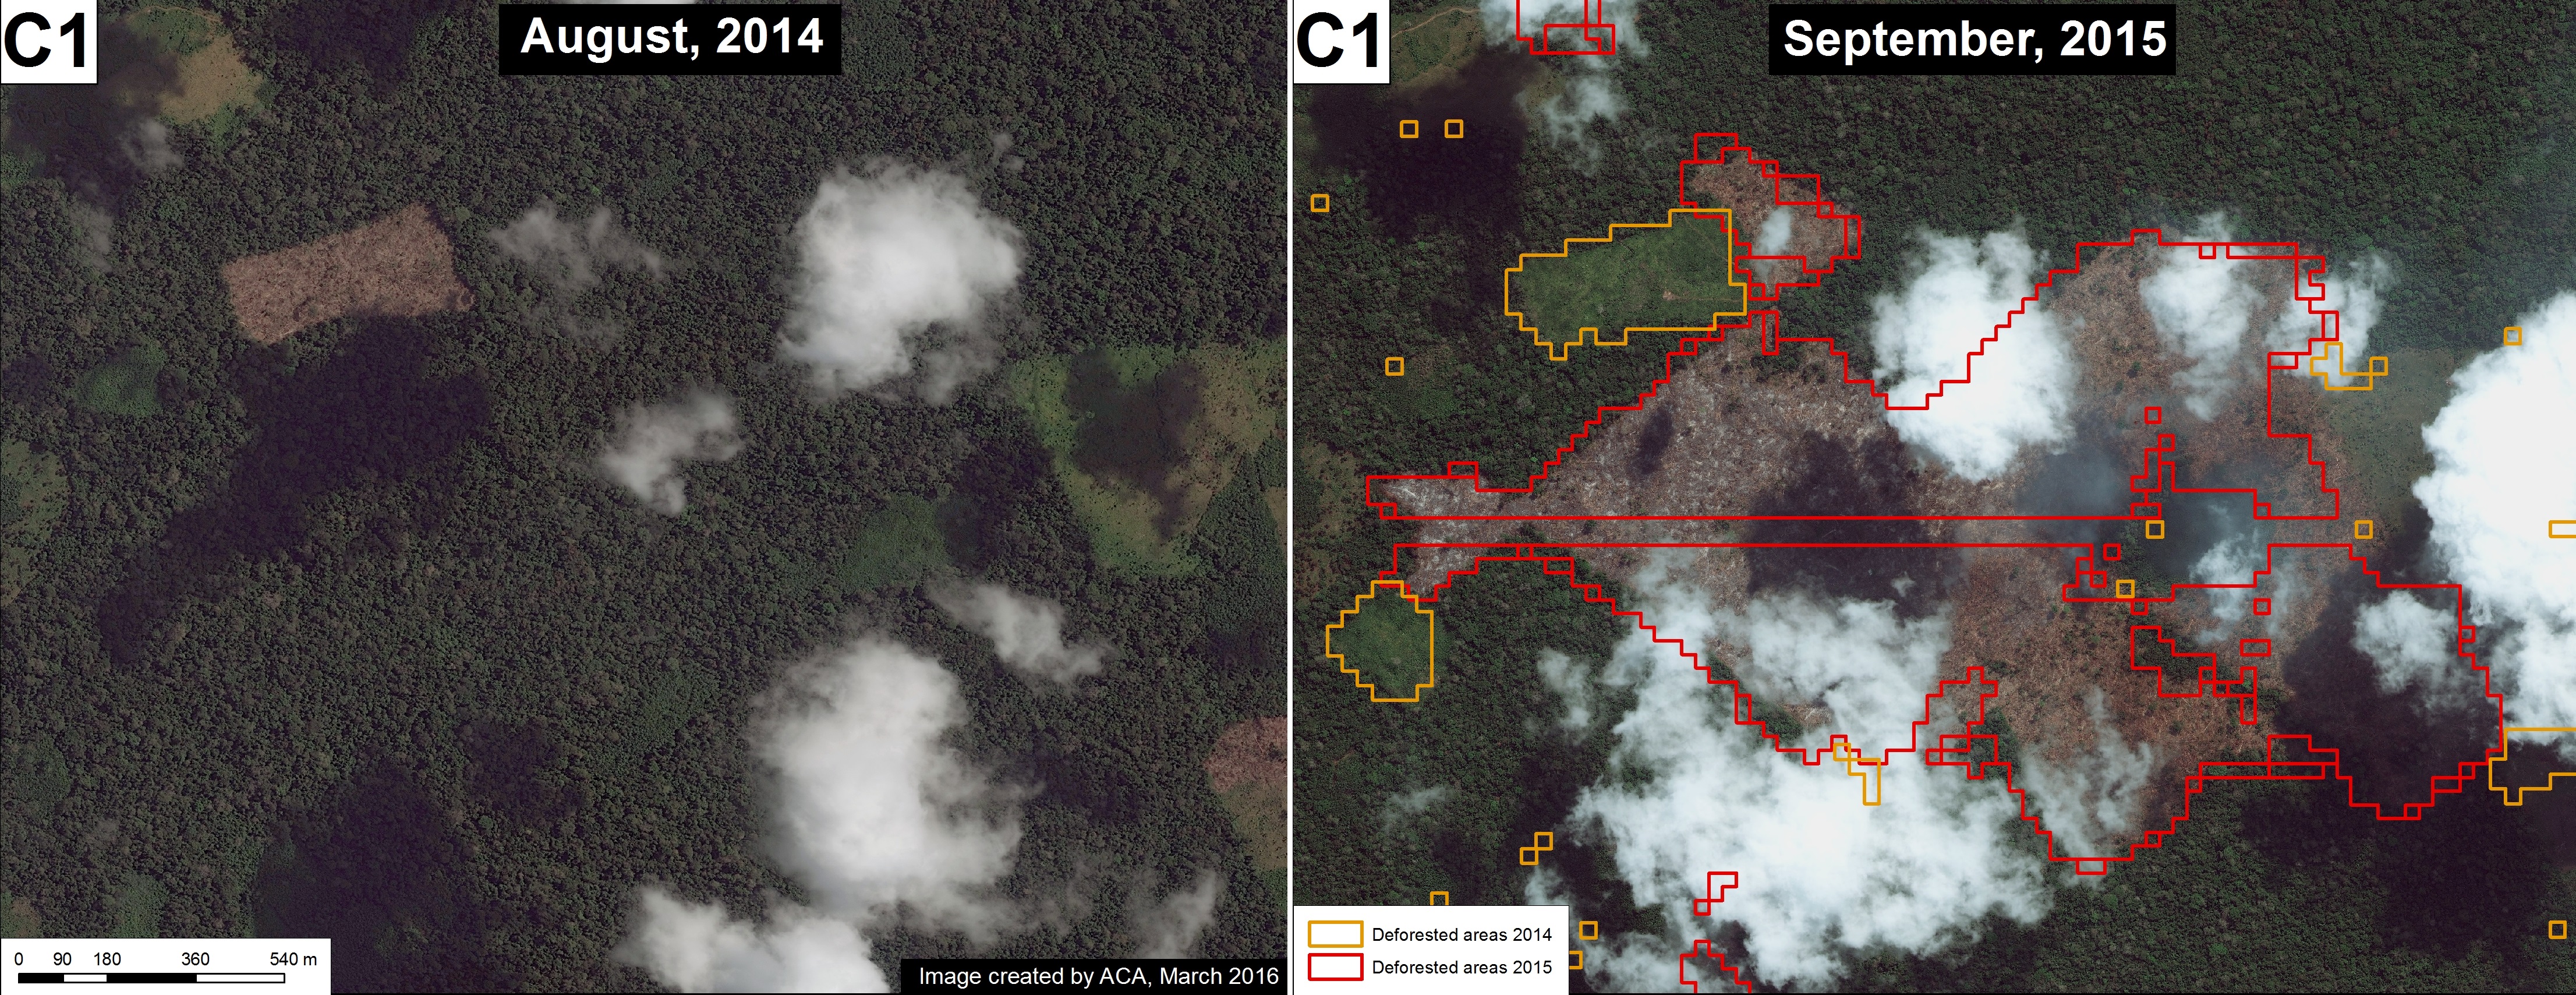
Image 37c. Data: WorldView of Digital Globe (NextView).
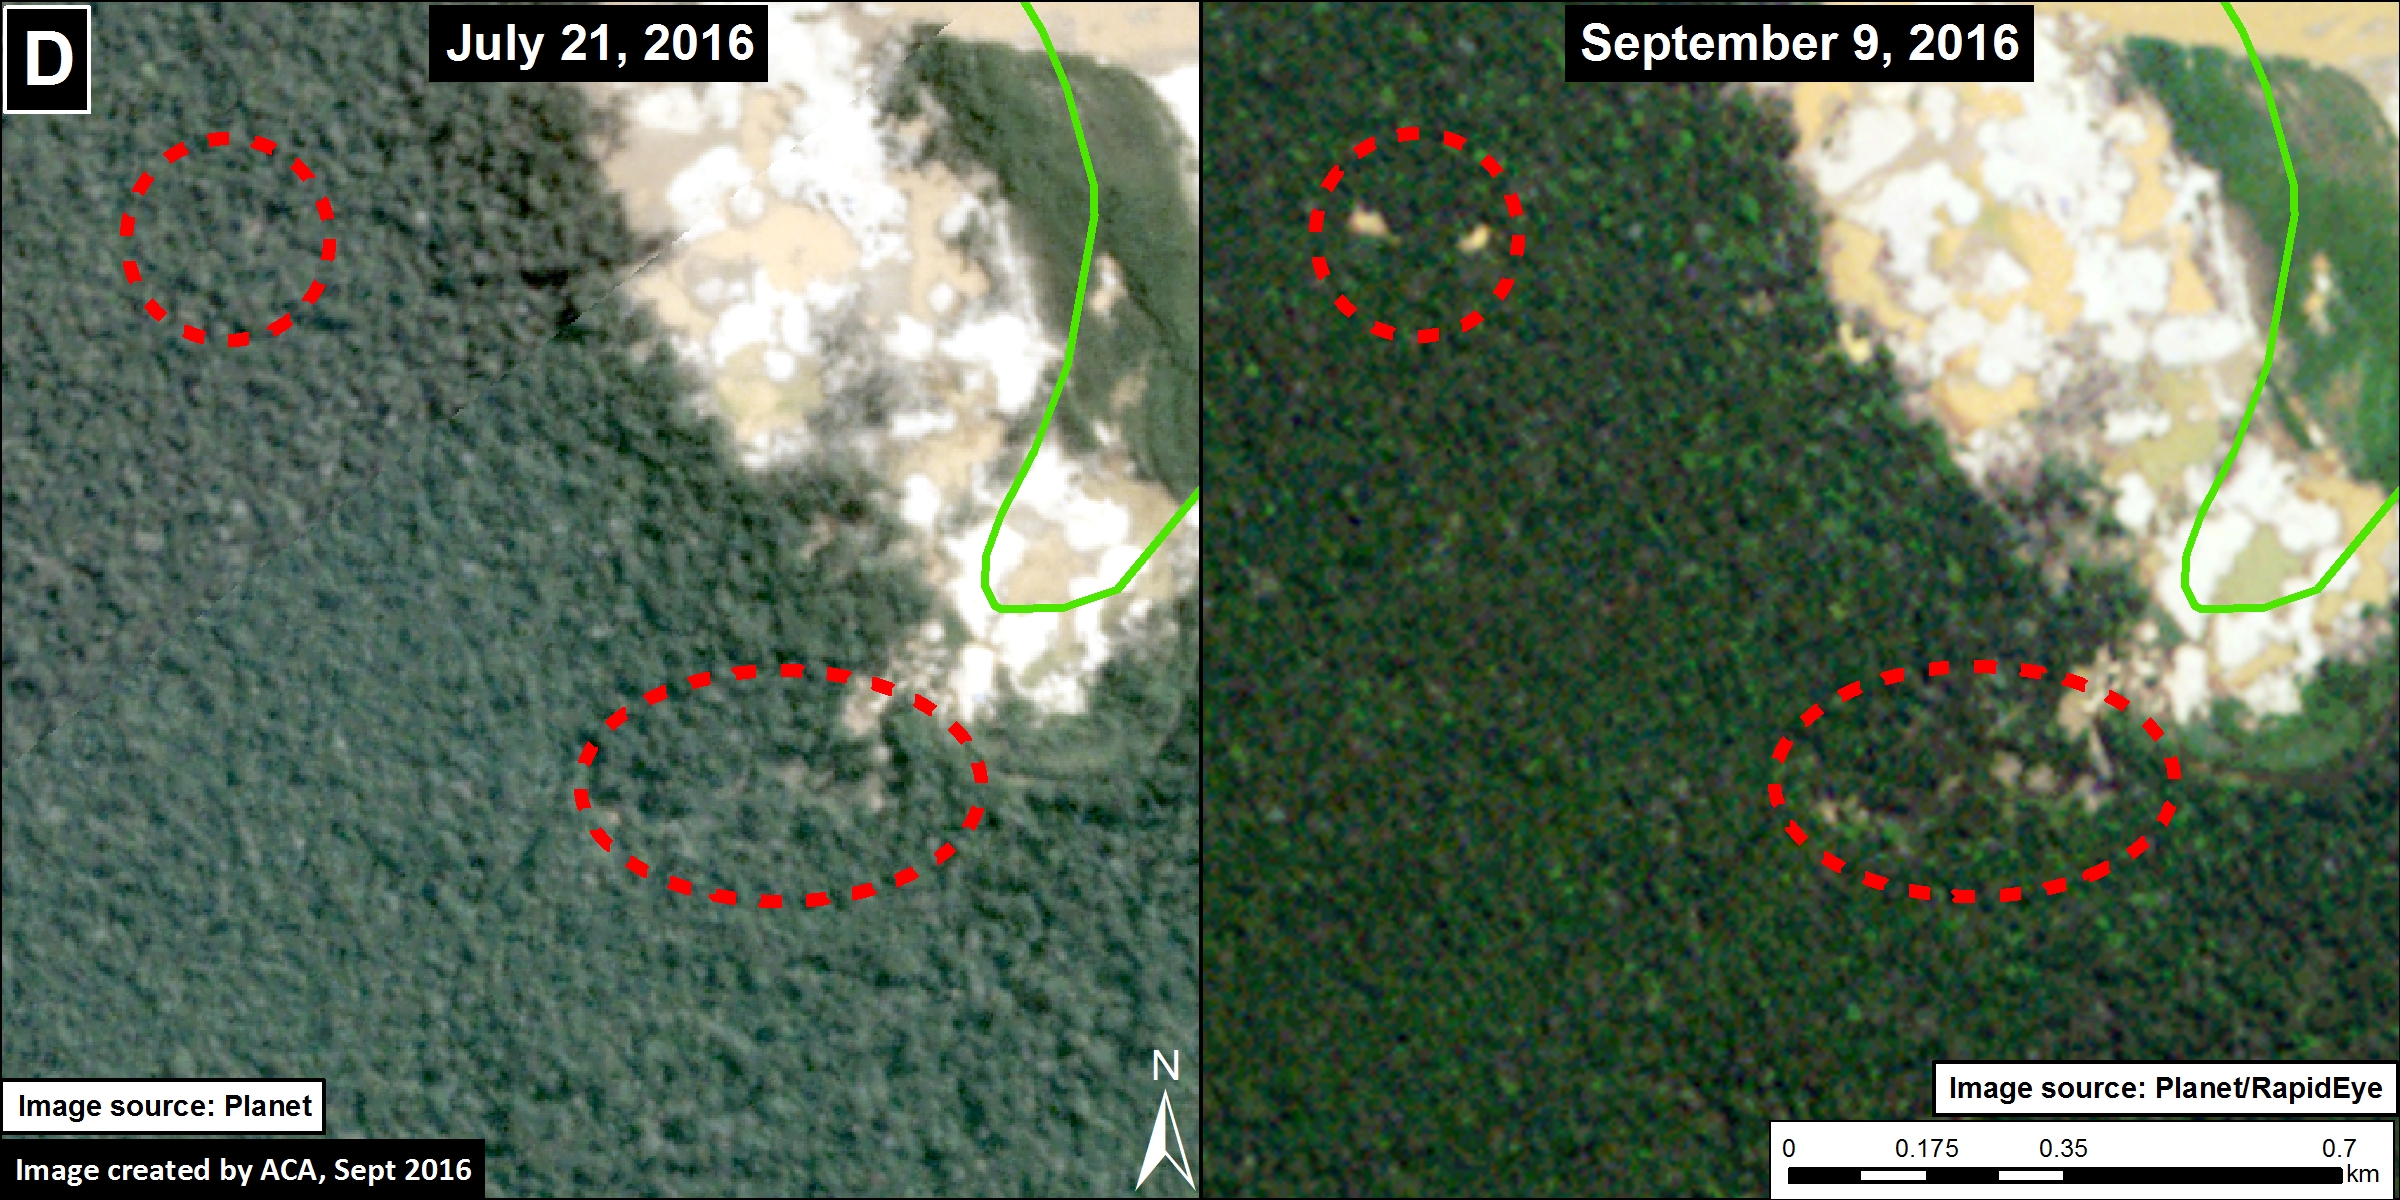
Inset D Hotspot

Huanuco_zoomD_v5
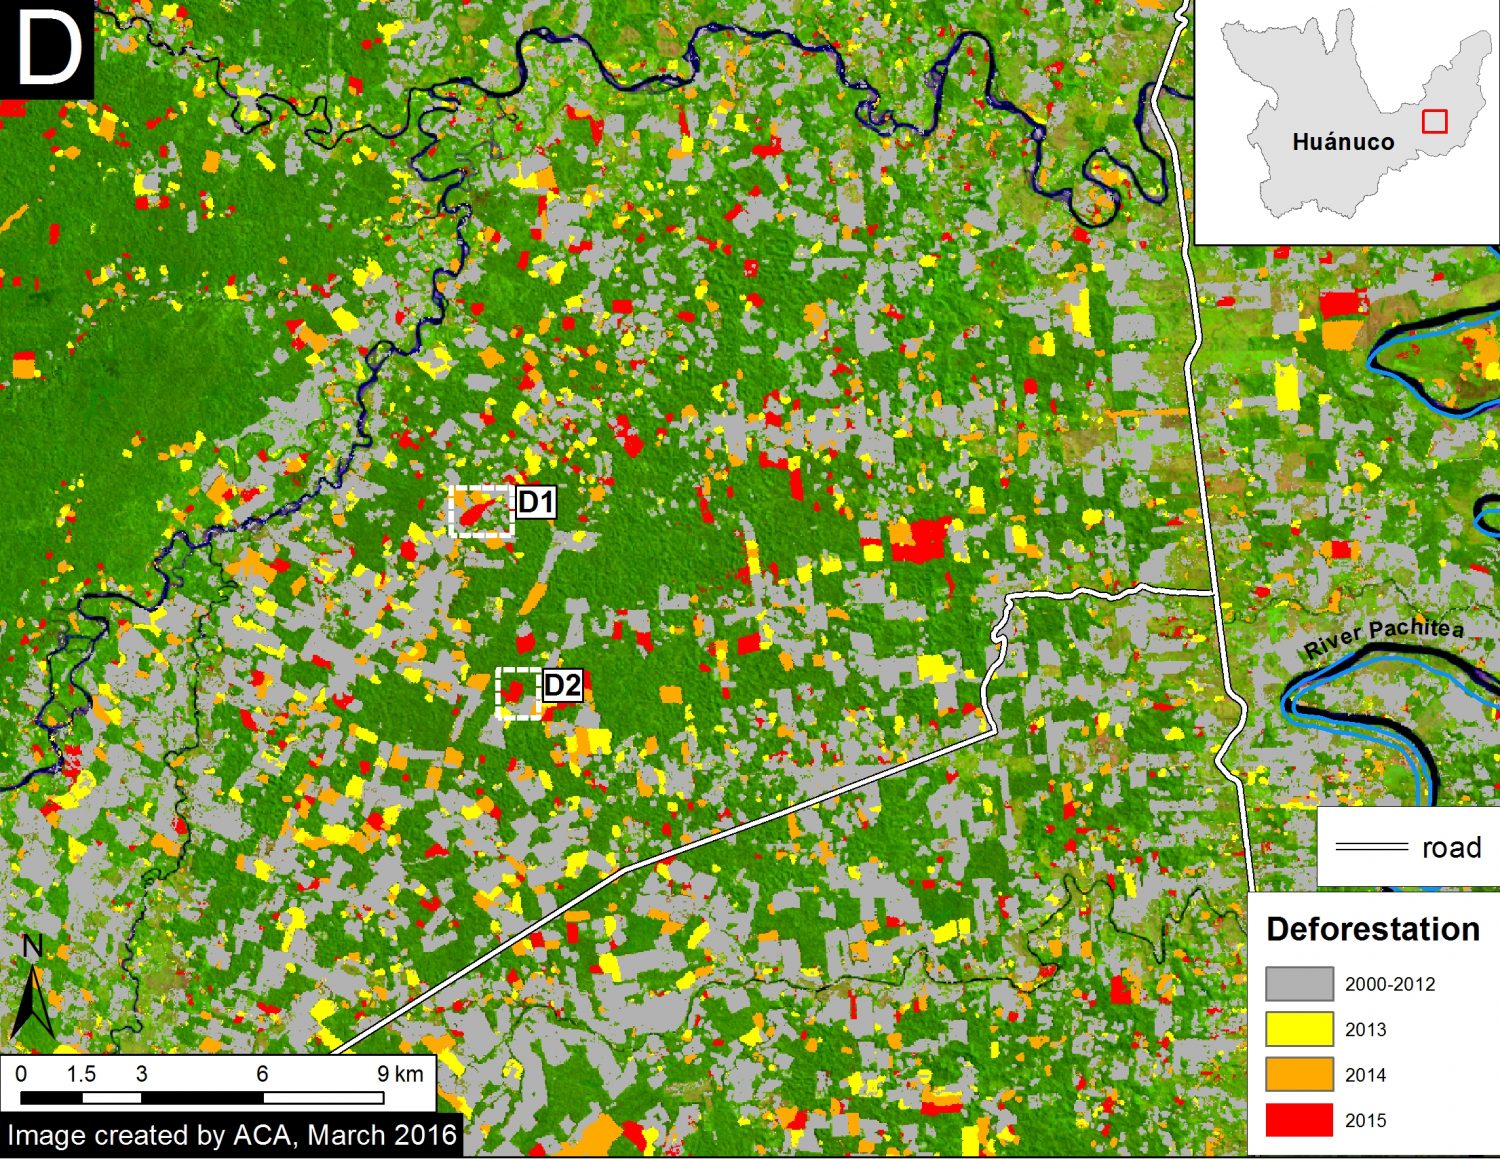
Image 37d. Data: PNCB/MINAM, UMD/GLAD, MTC

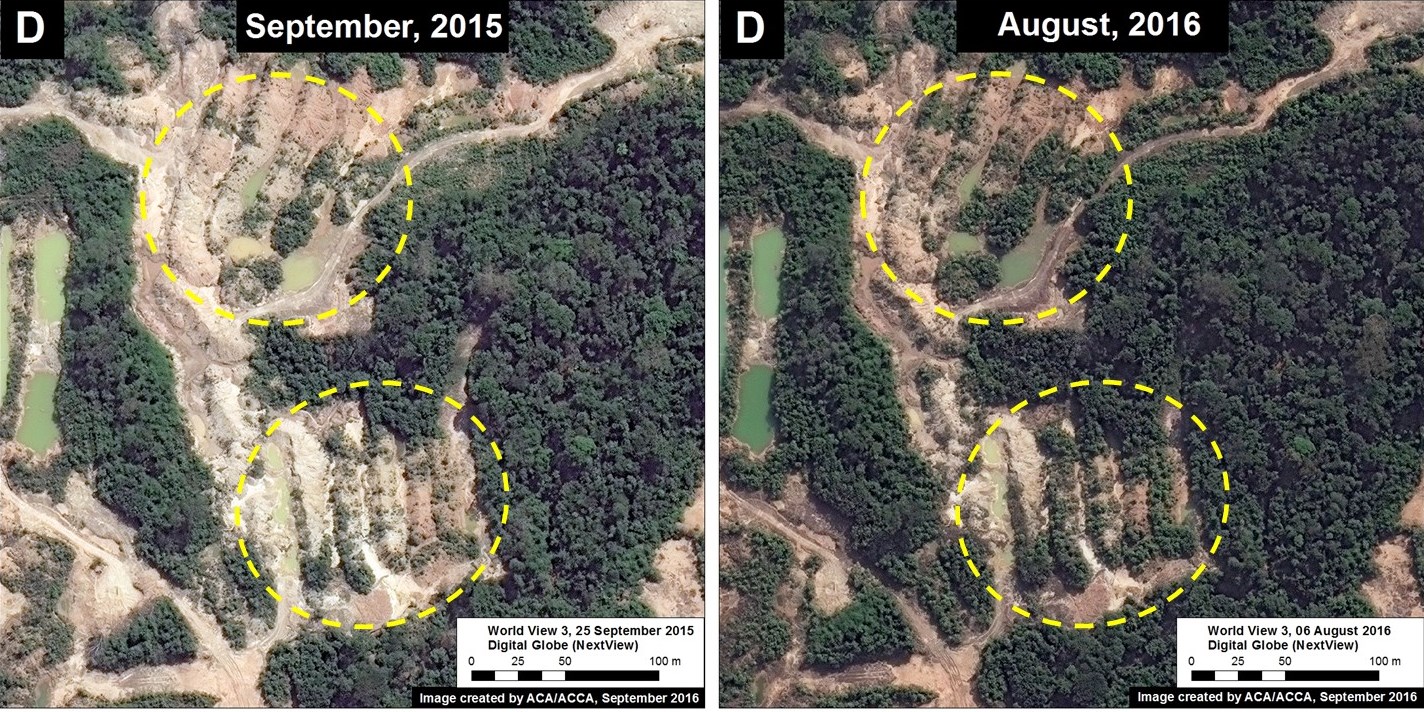
Image 37d shows a detailed view of the deforestation inside the area indicated by Inset D.

In this area, we documented deforestation of 2,883 hectares in 2015. Of this total, 44% of the deforestation events were small-scale (<5 ha), 51% were medium-scale (5-50 ha), and 6% were large-scale (>50 ha).

We calculated an additional deforestation of 6,650 hectares in 2013 and 2014.

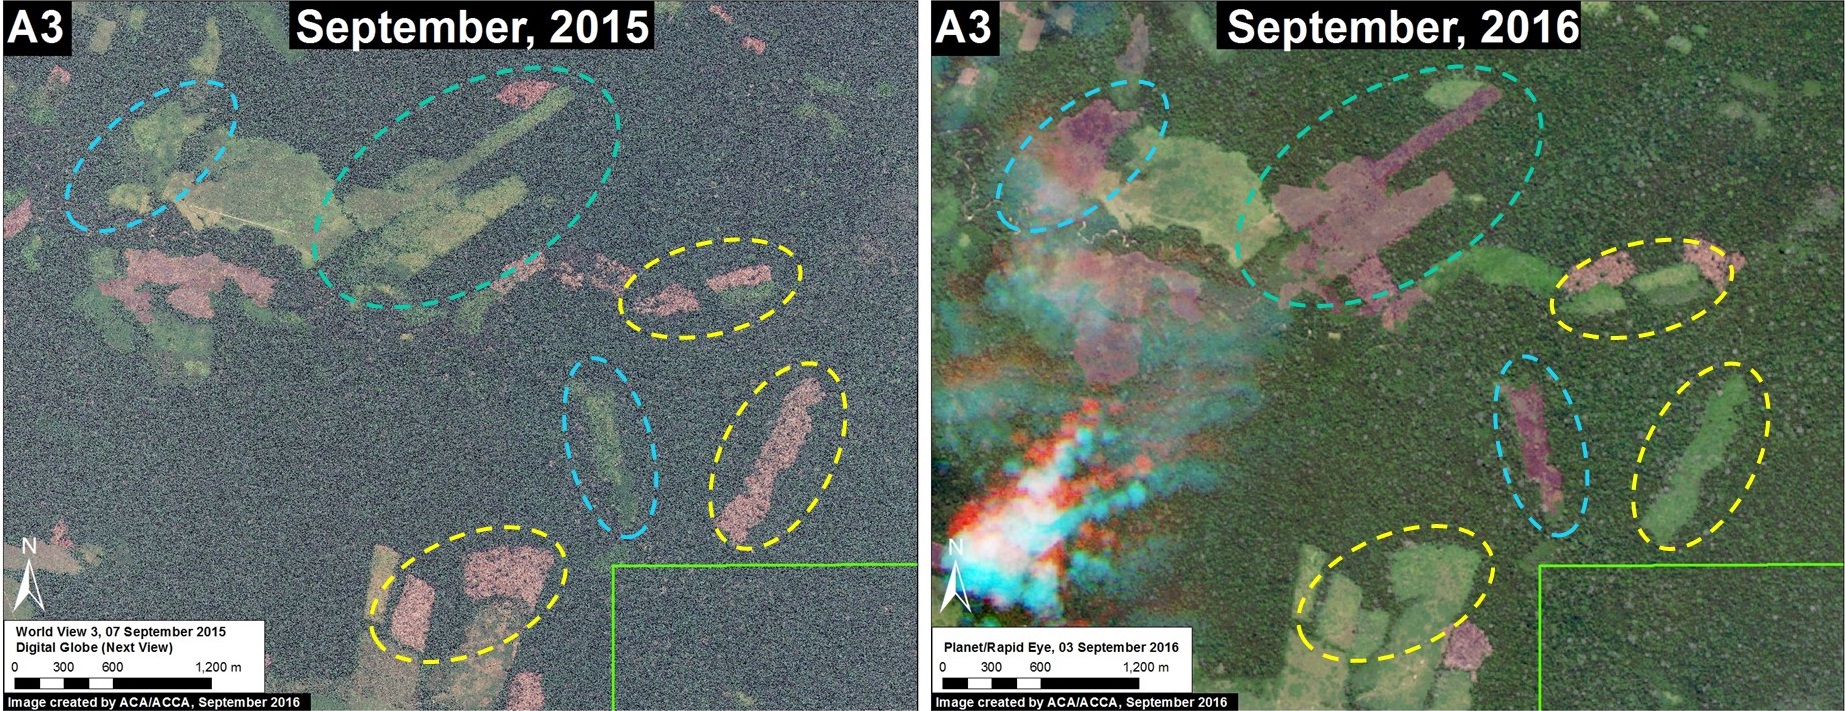
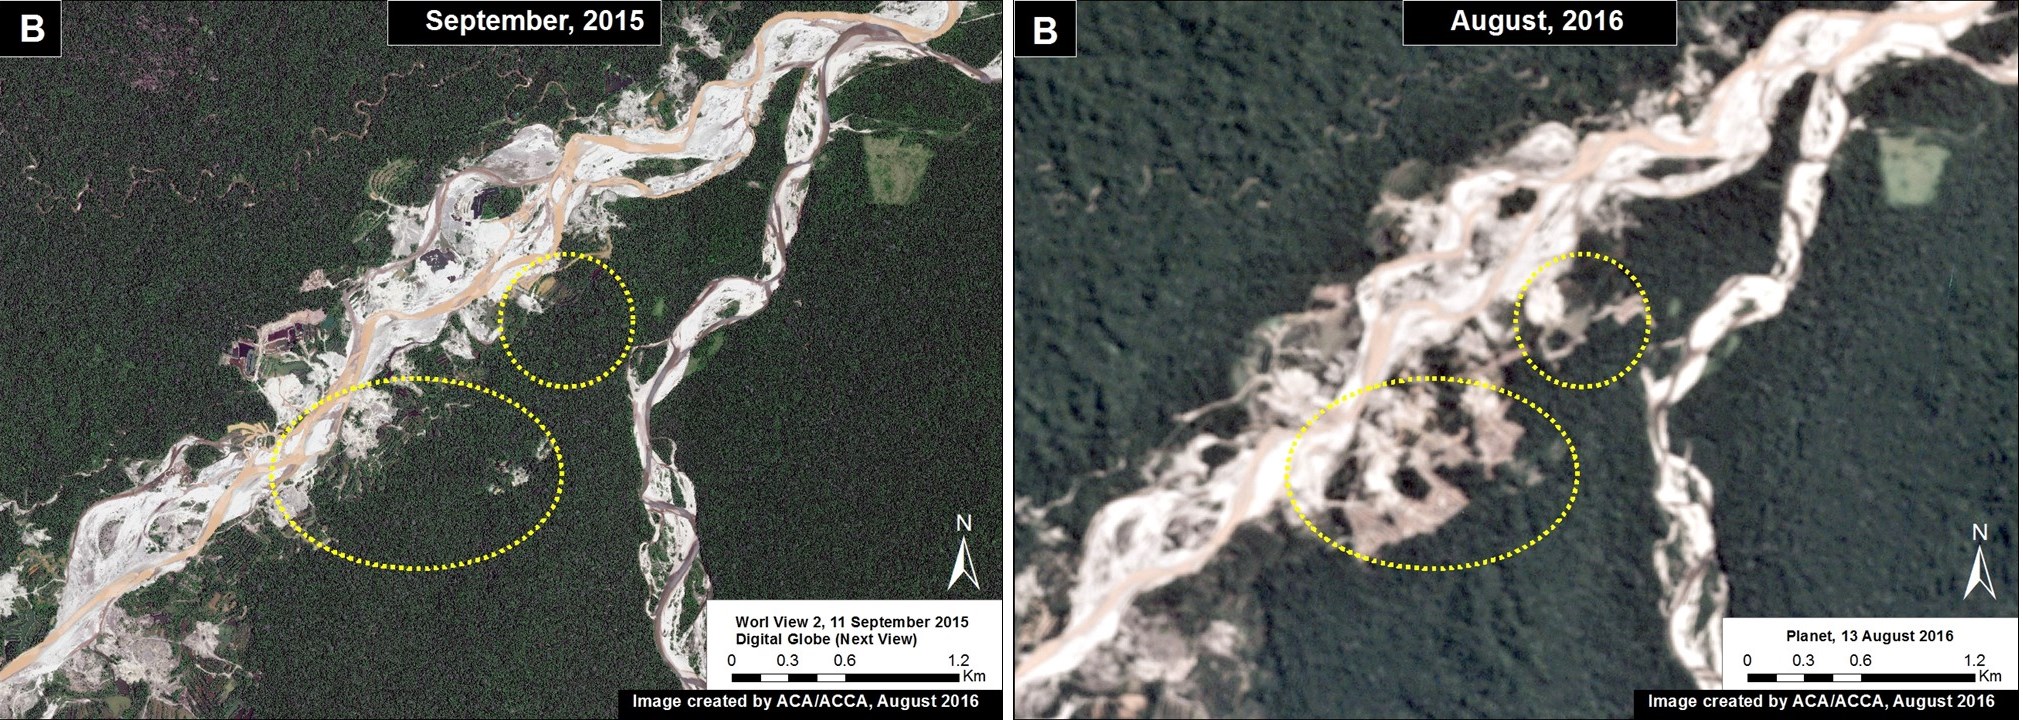
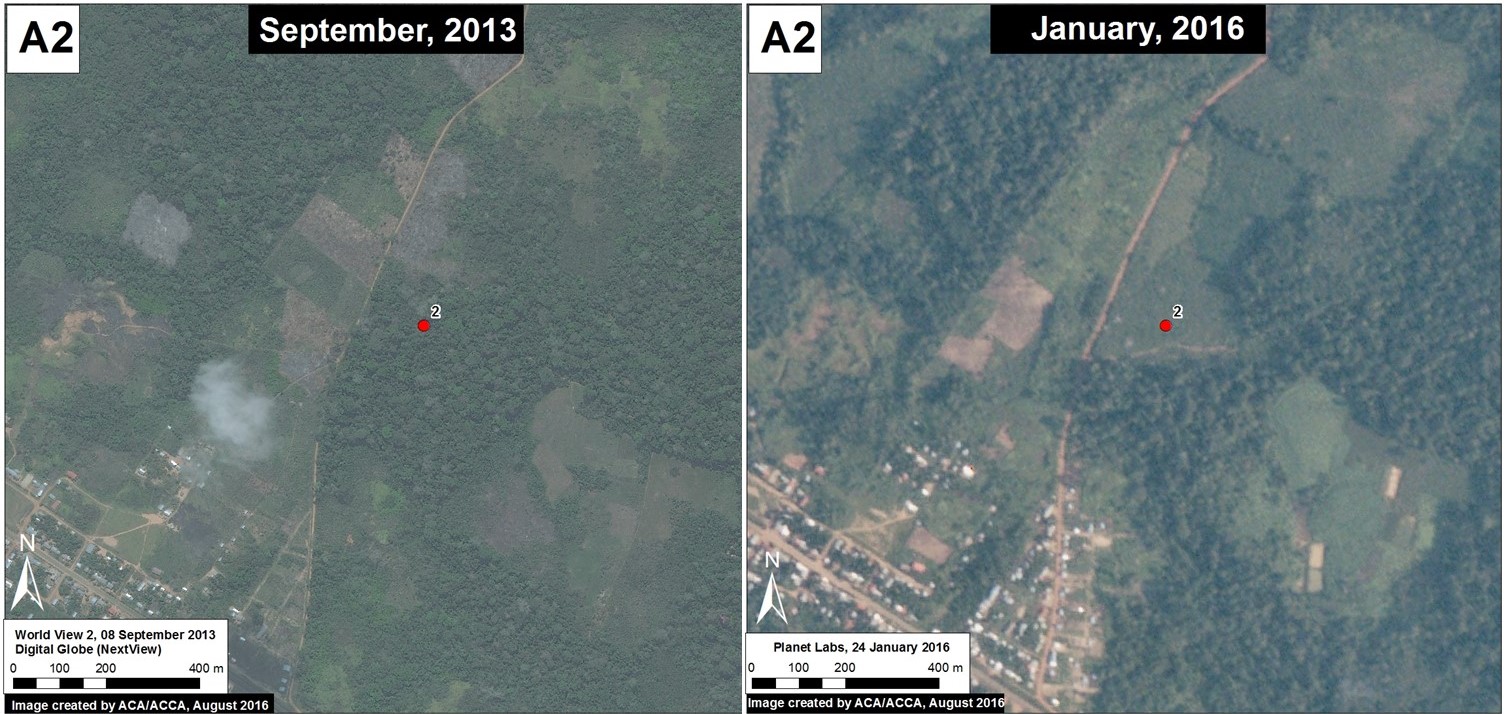
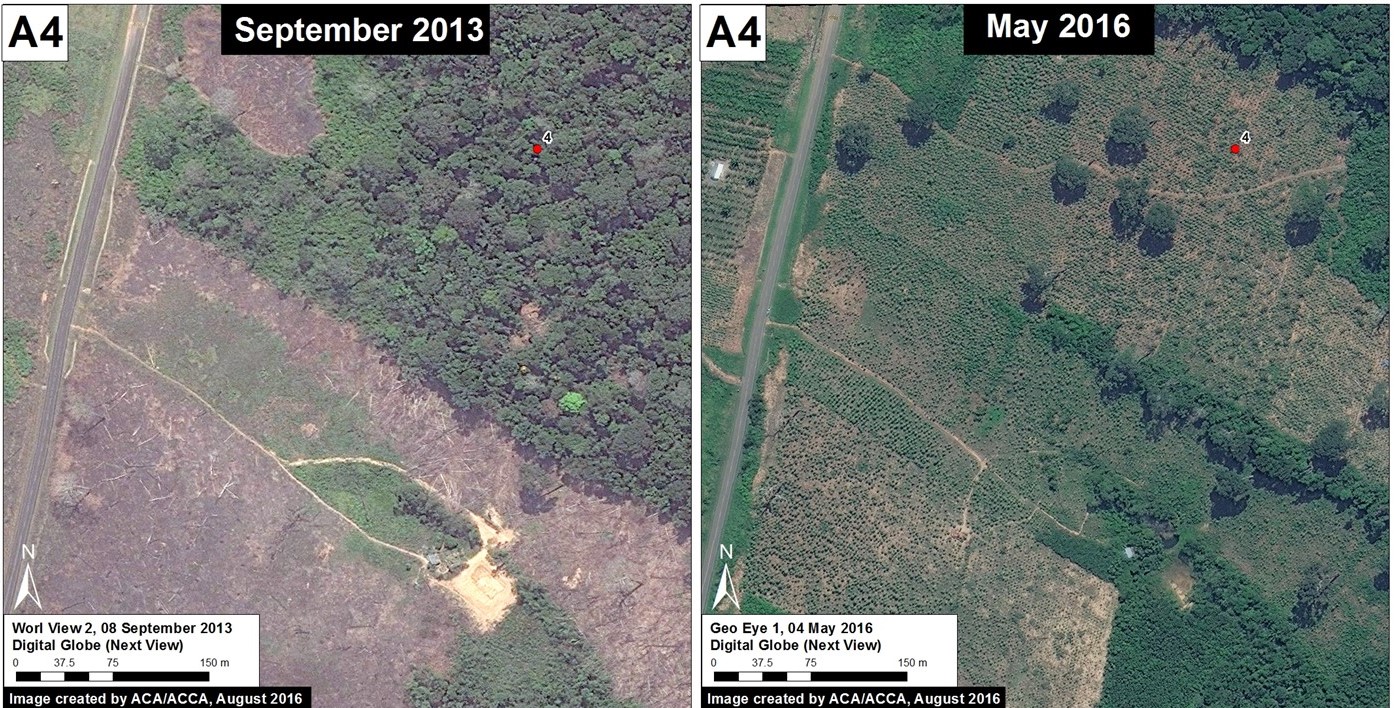
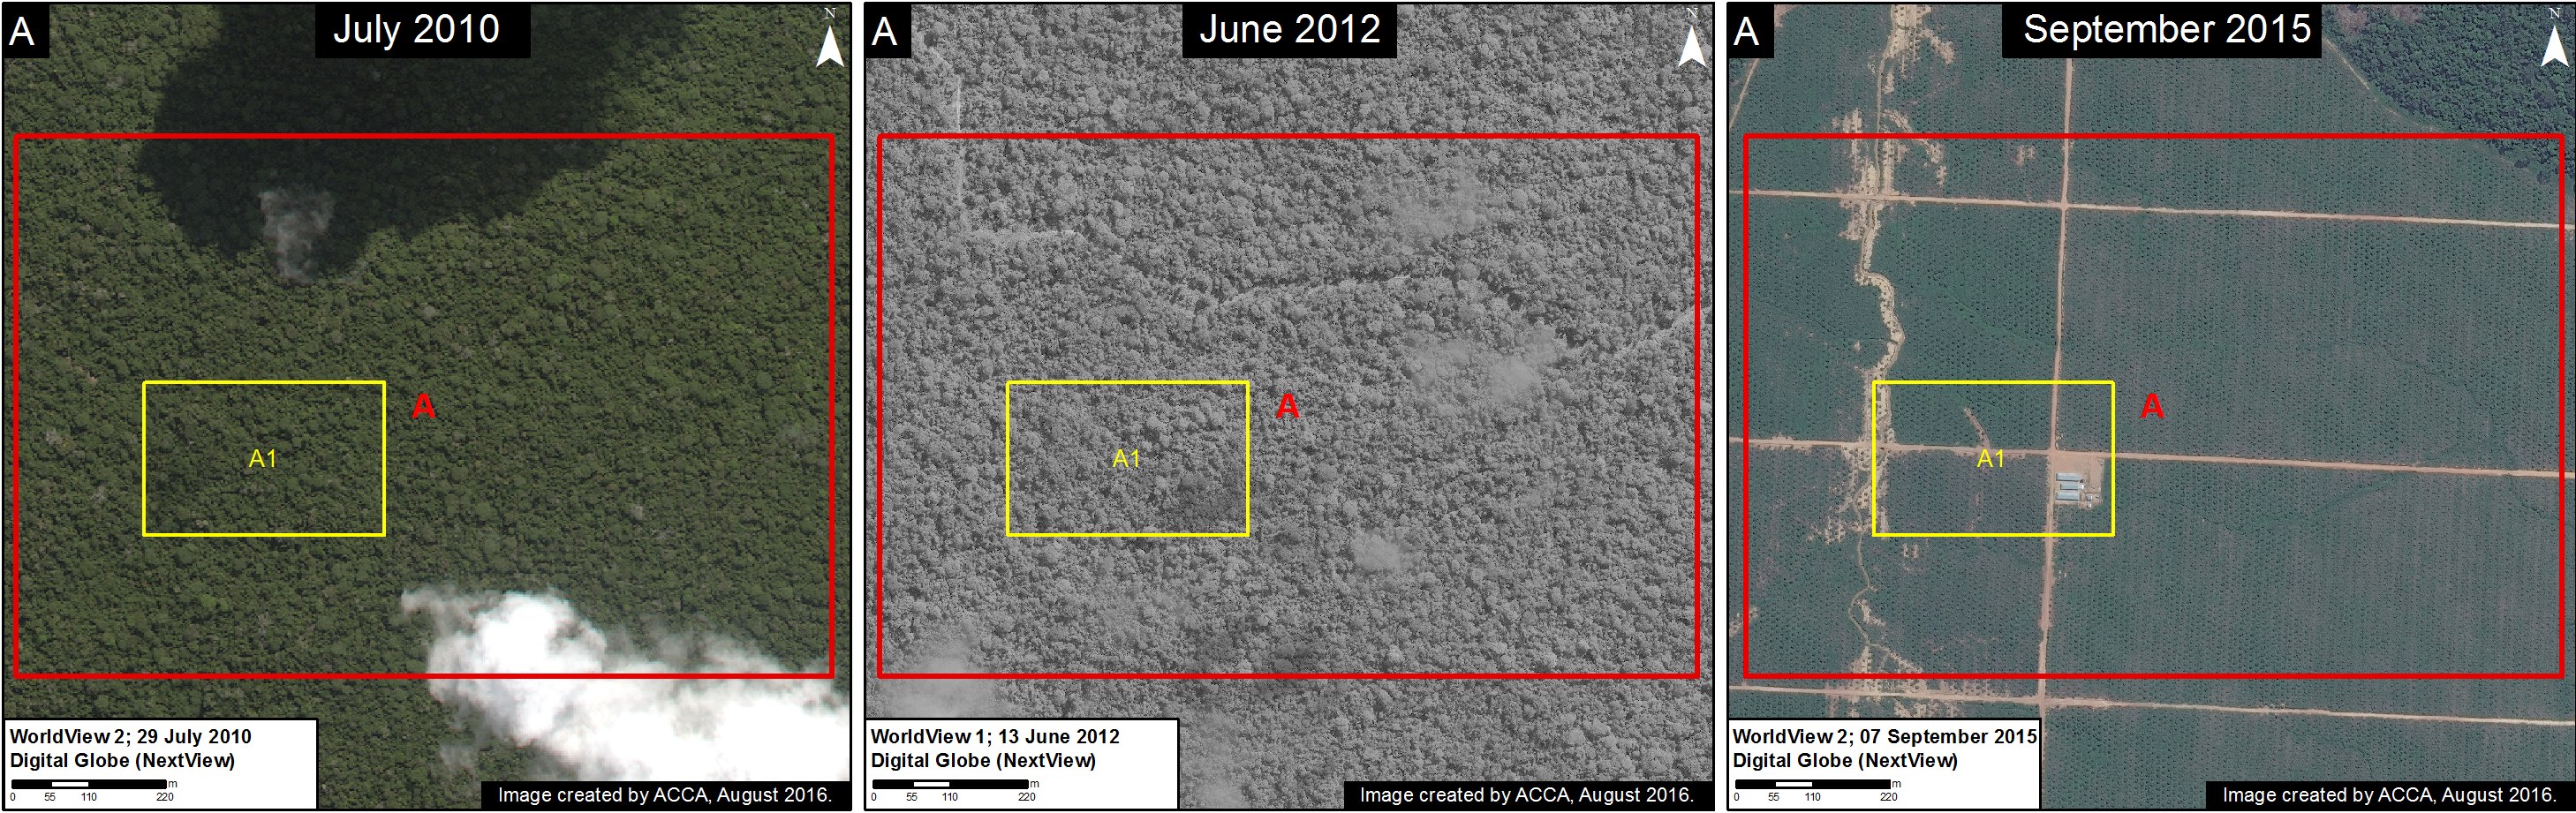
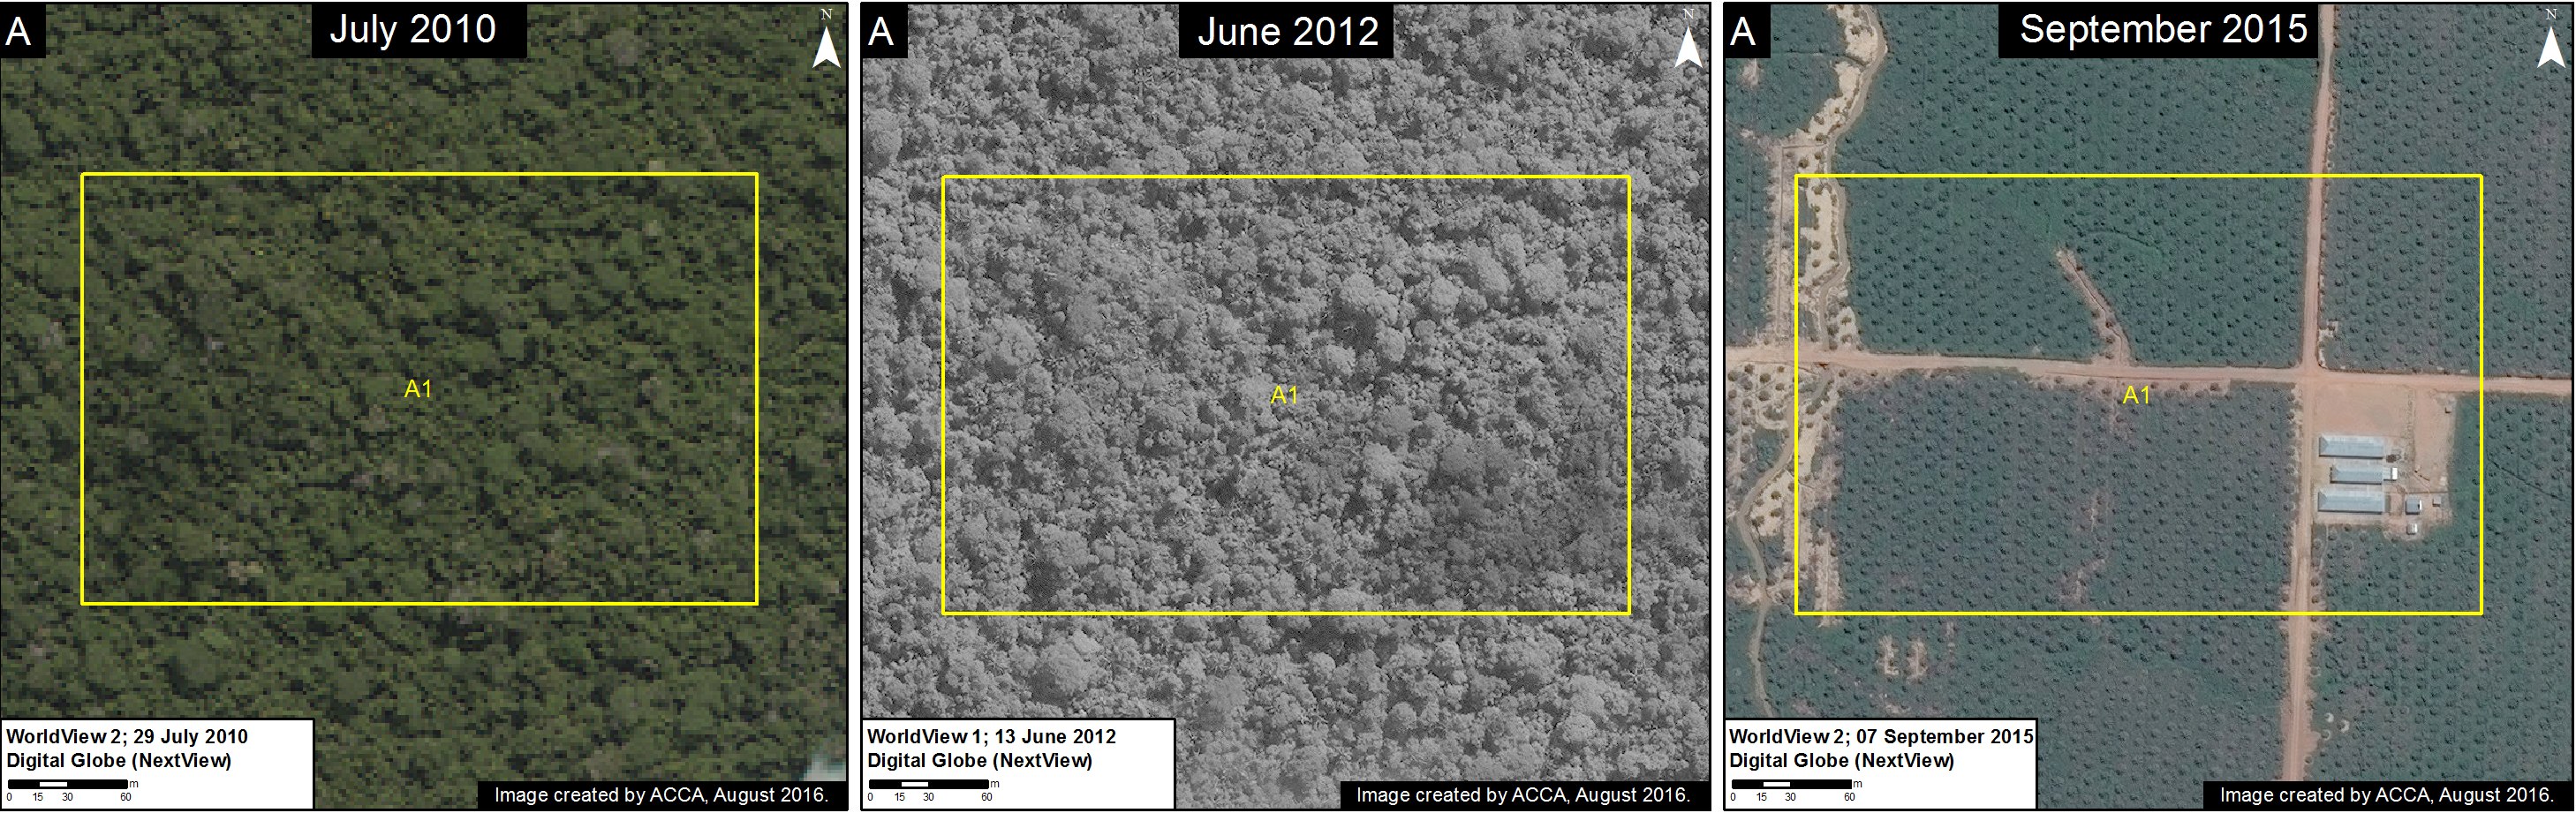
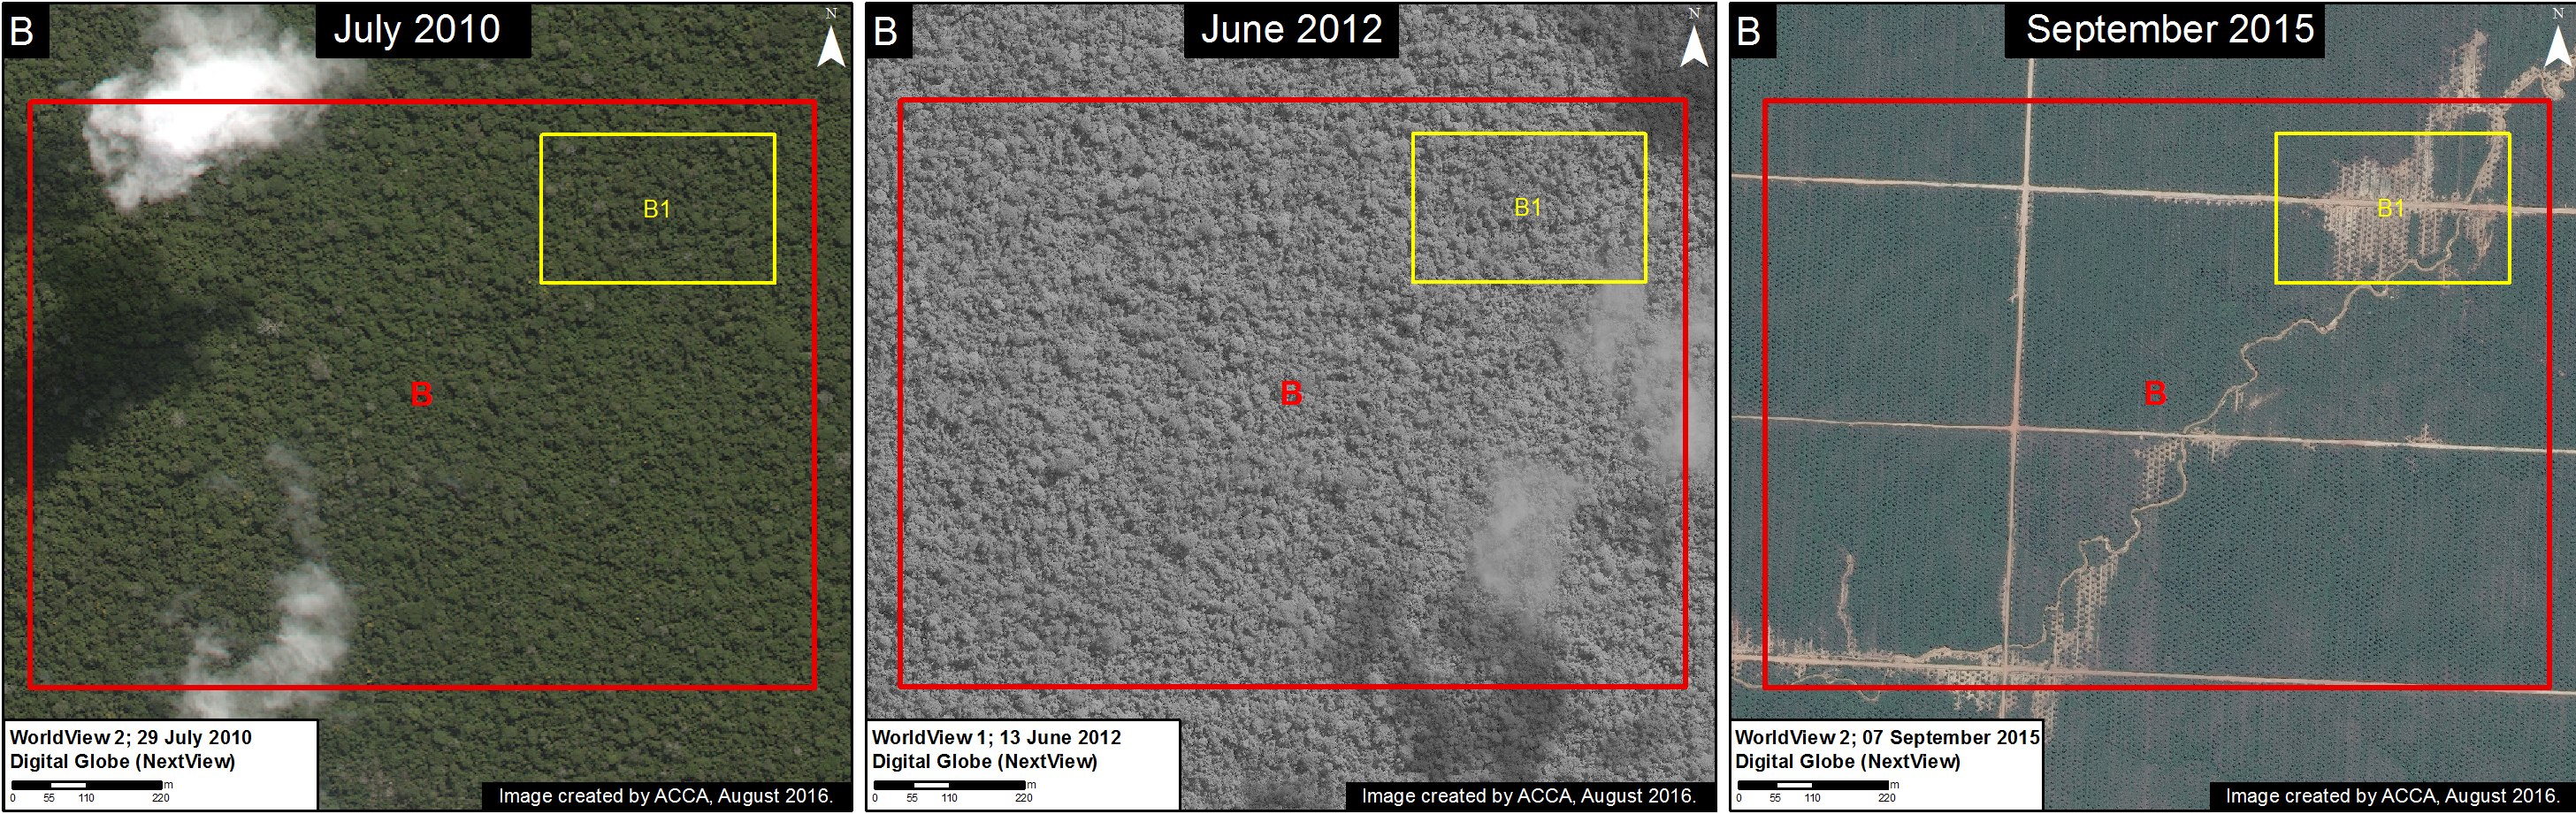
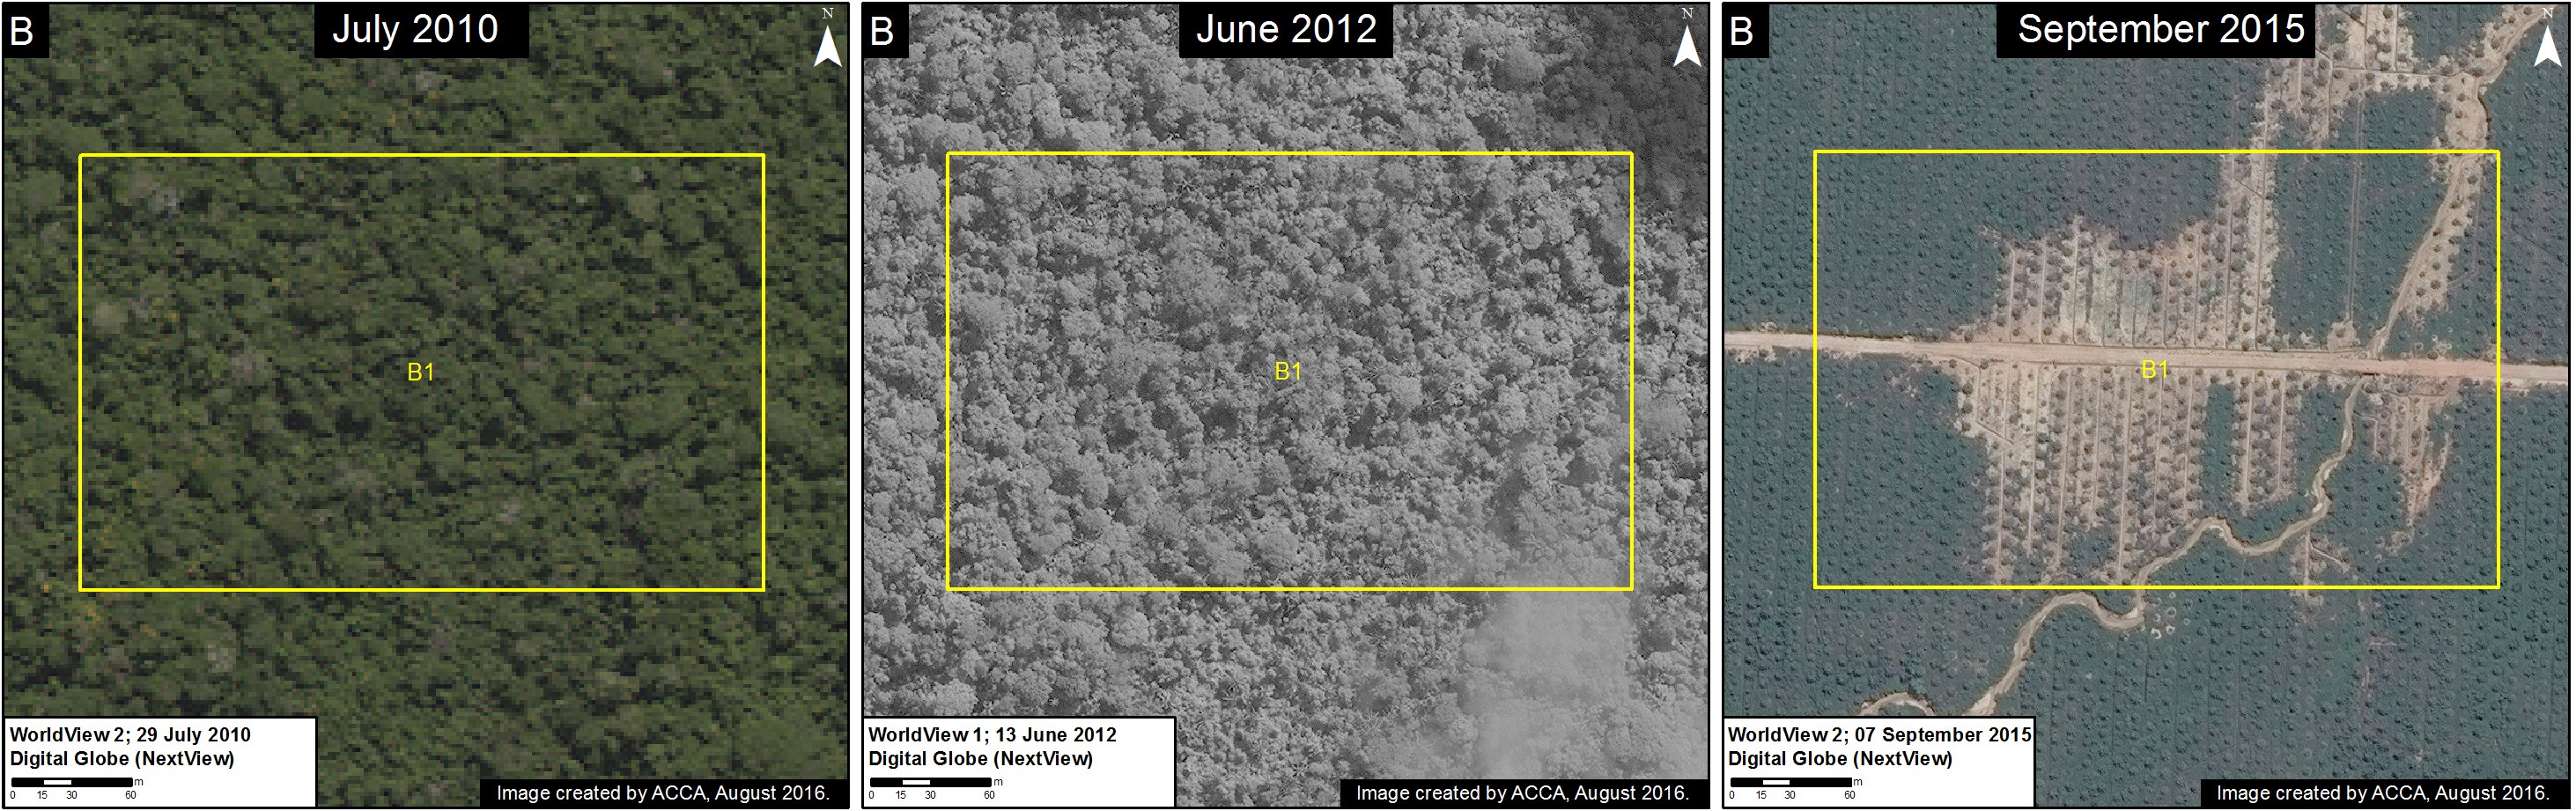
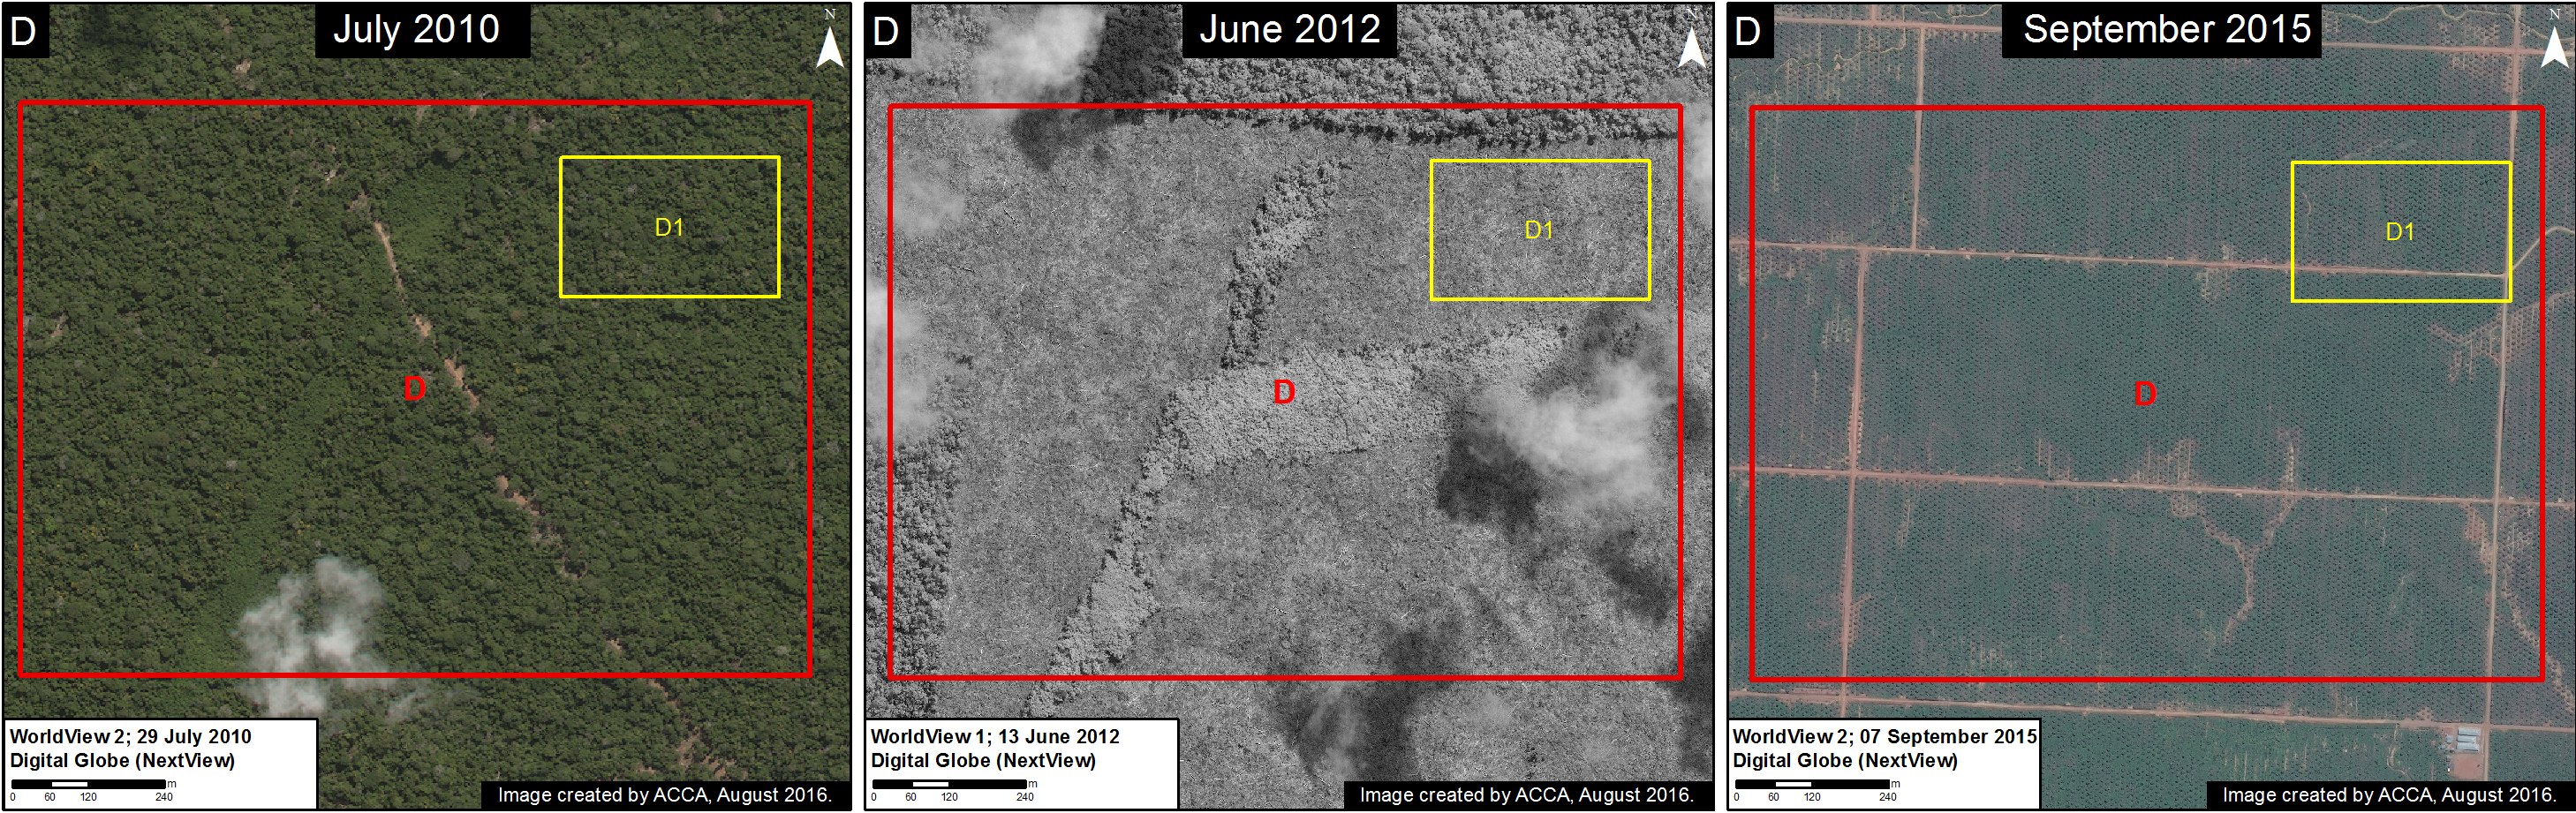
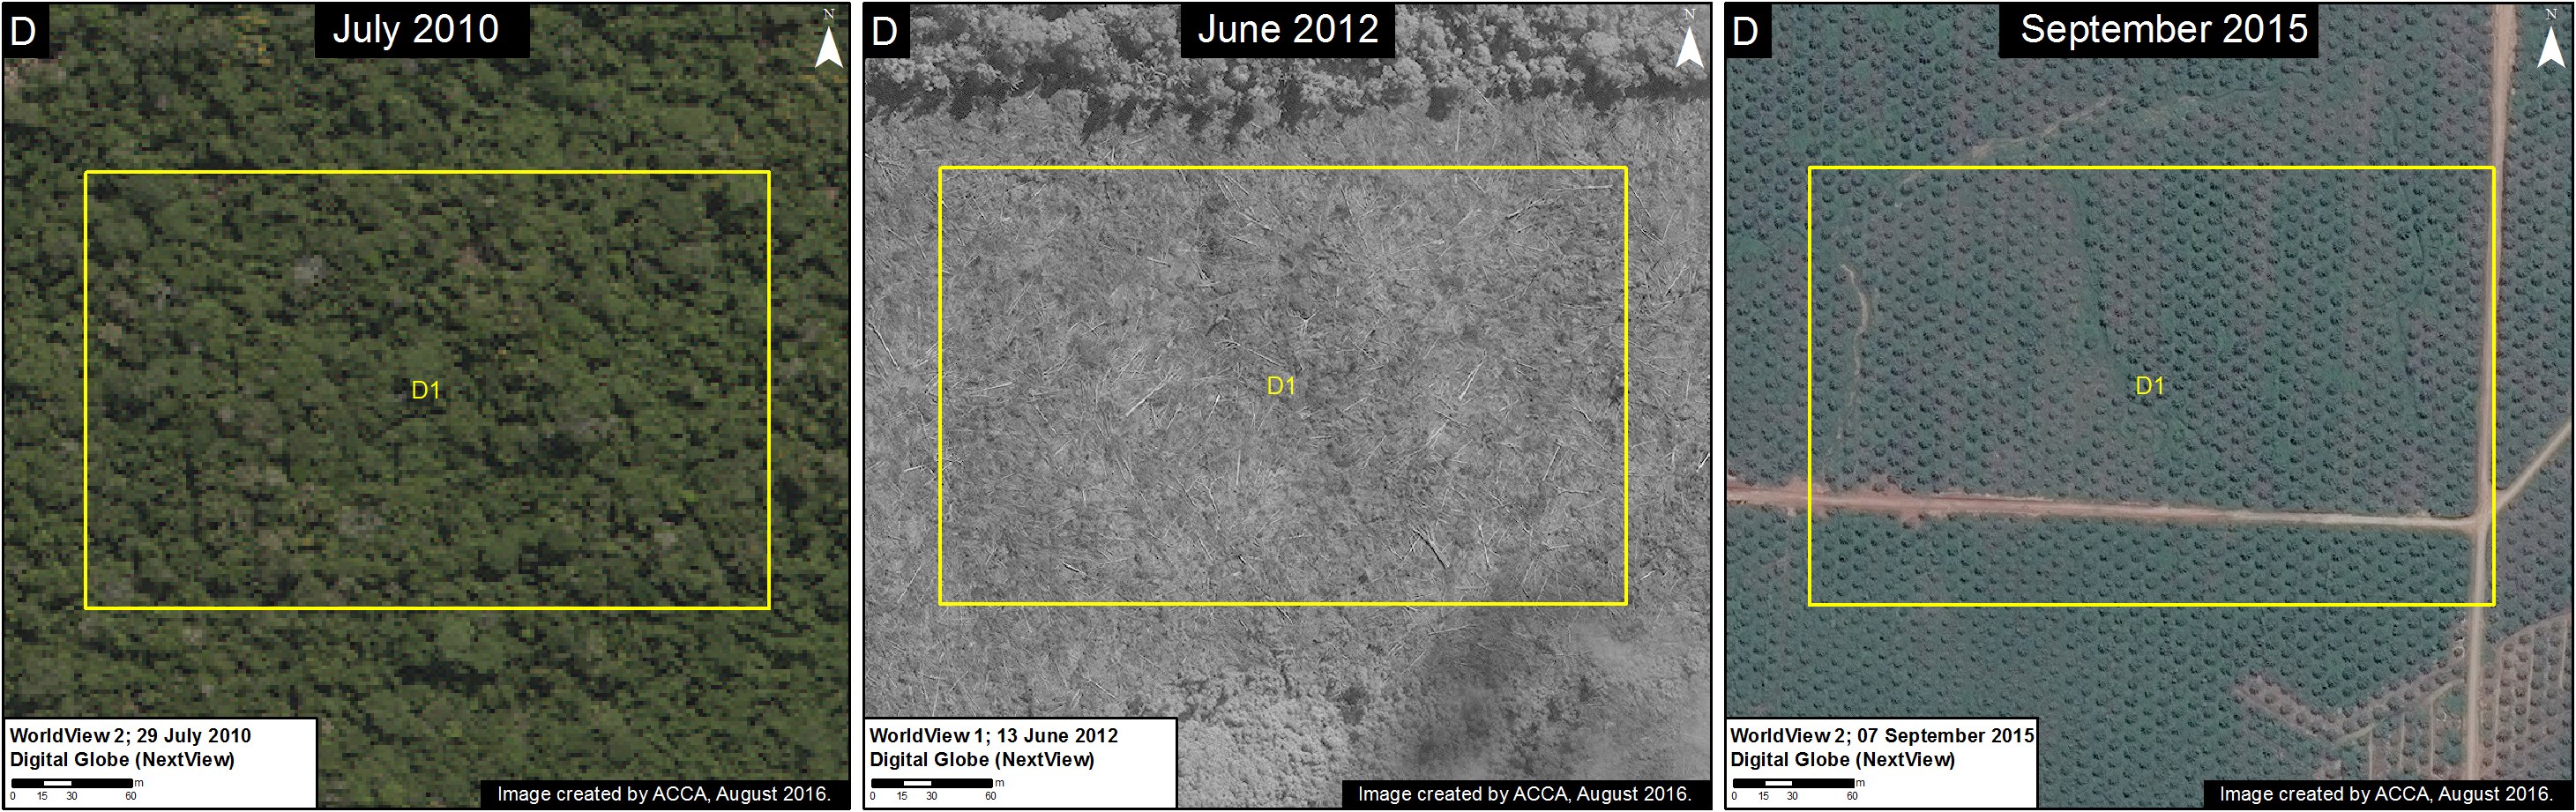
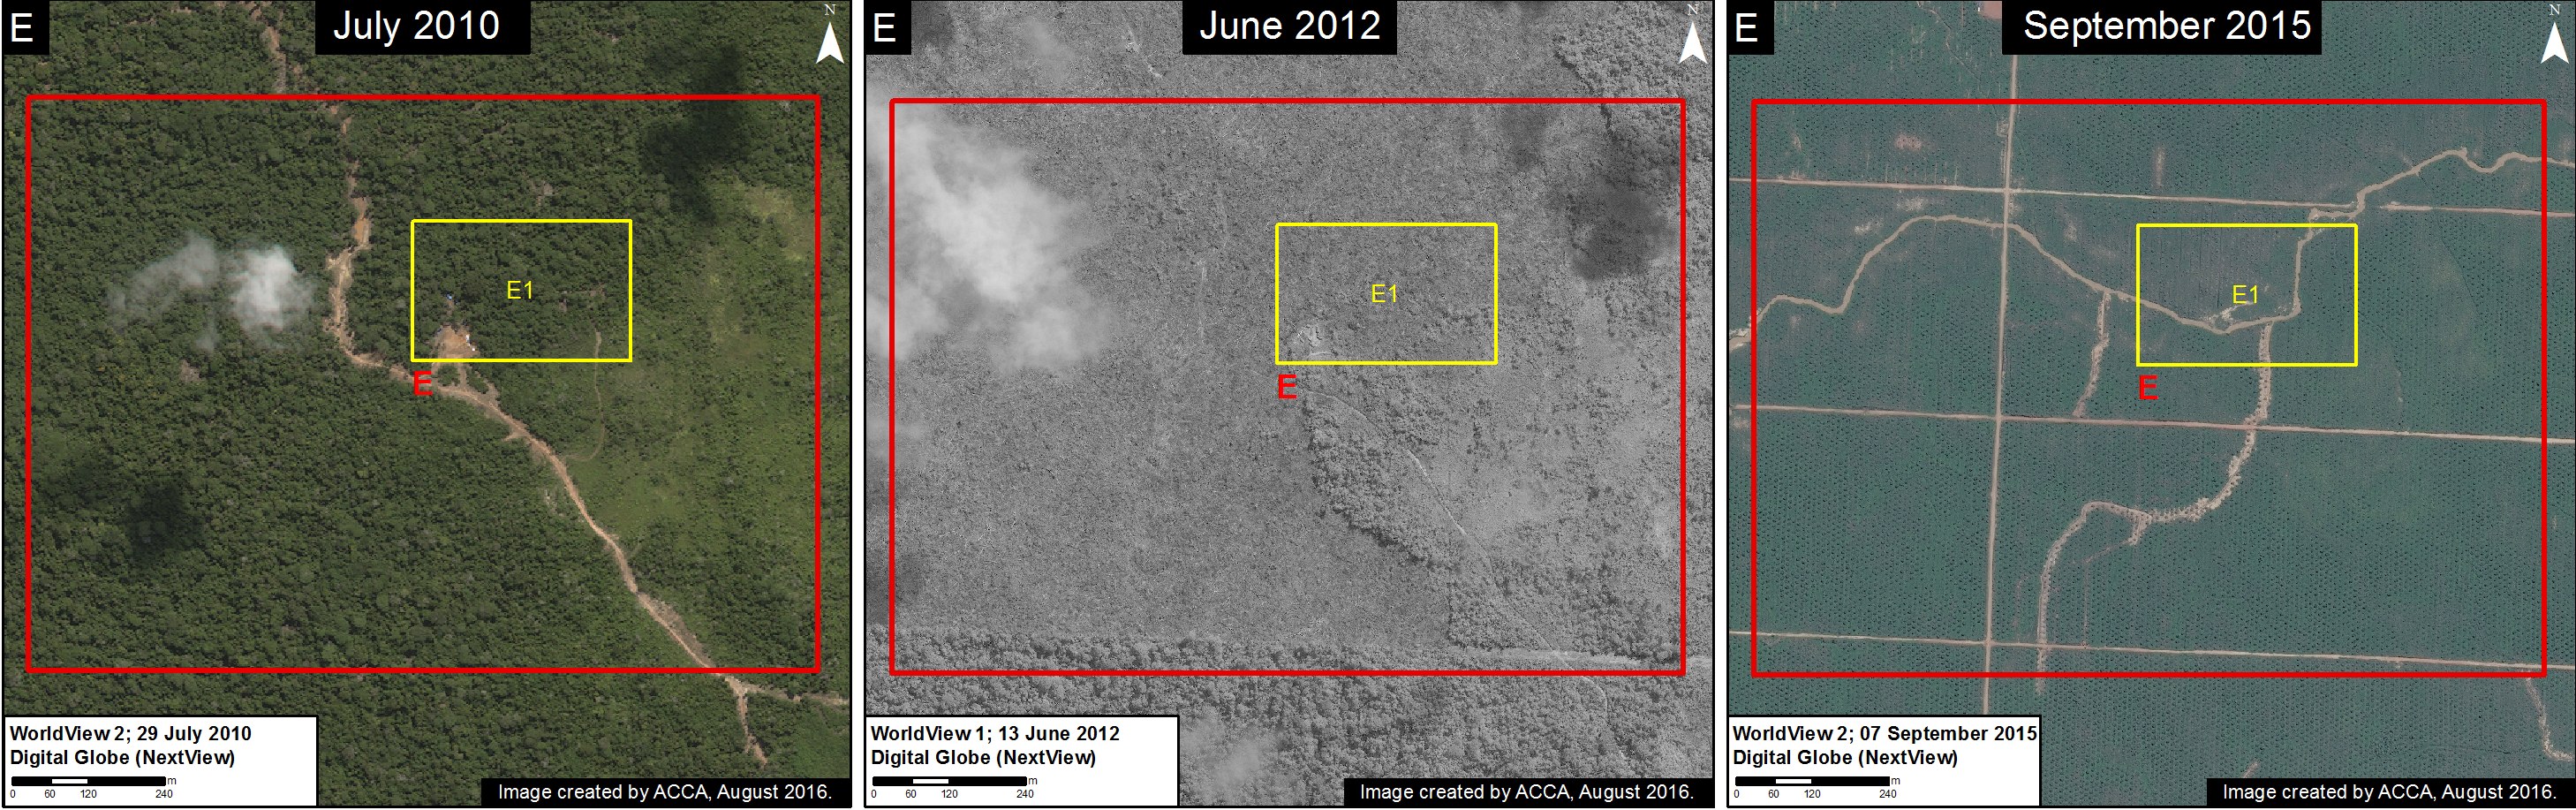
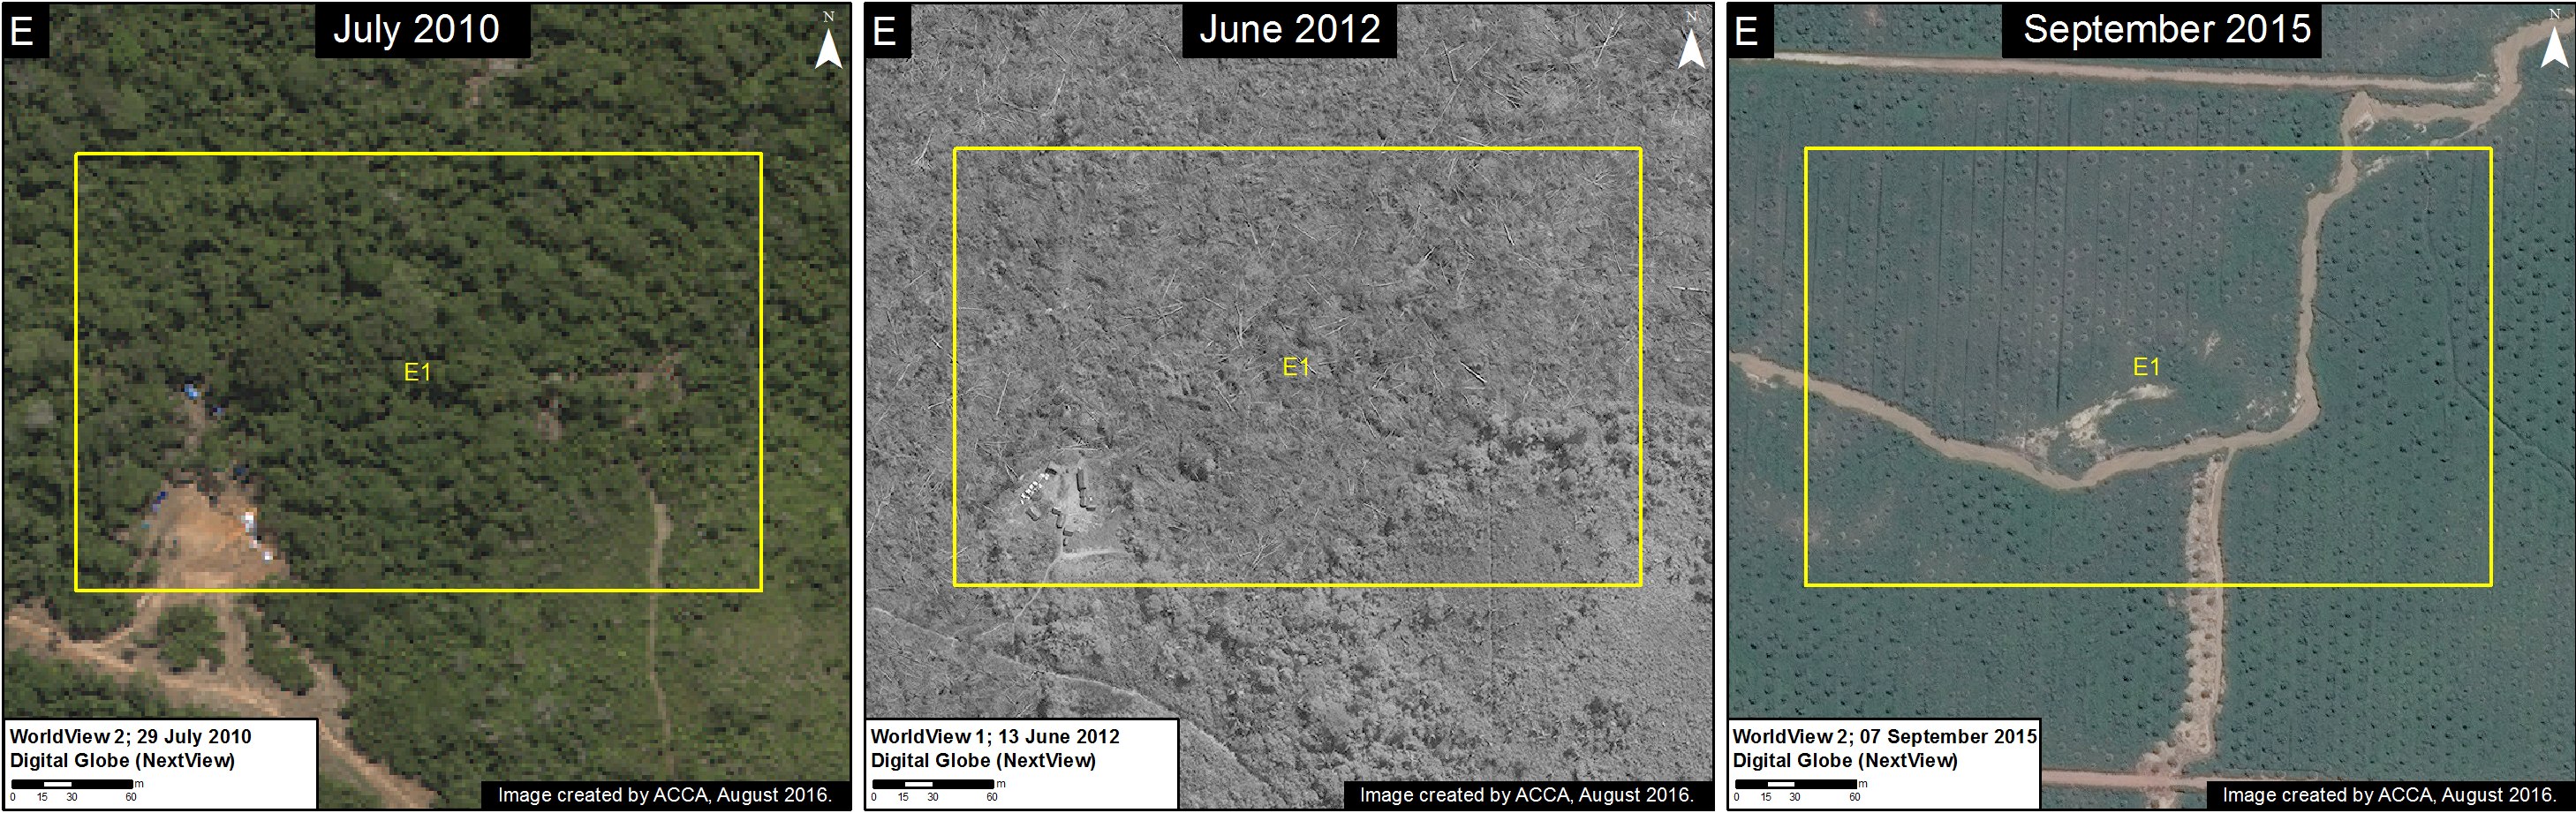
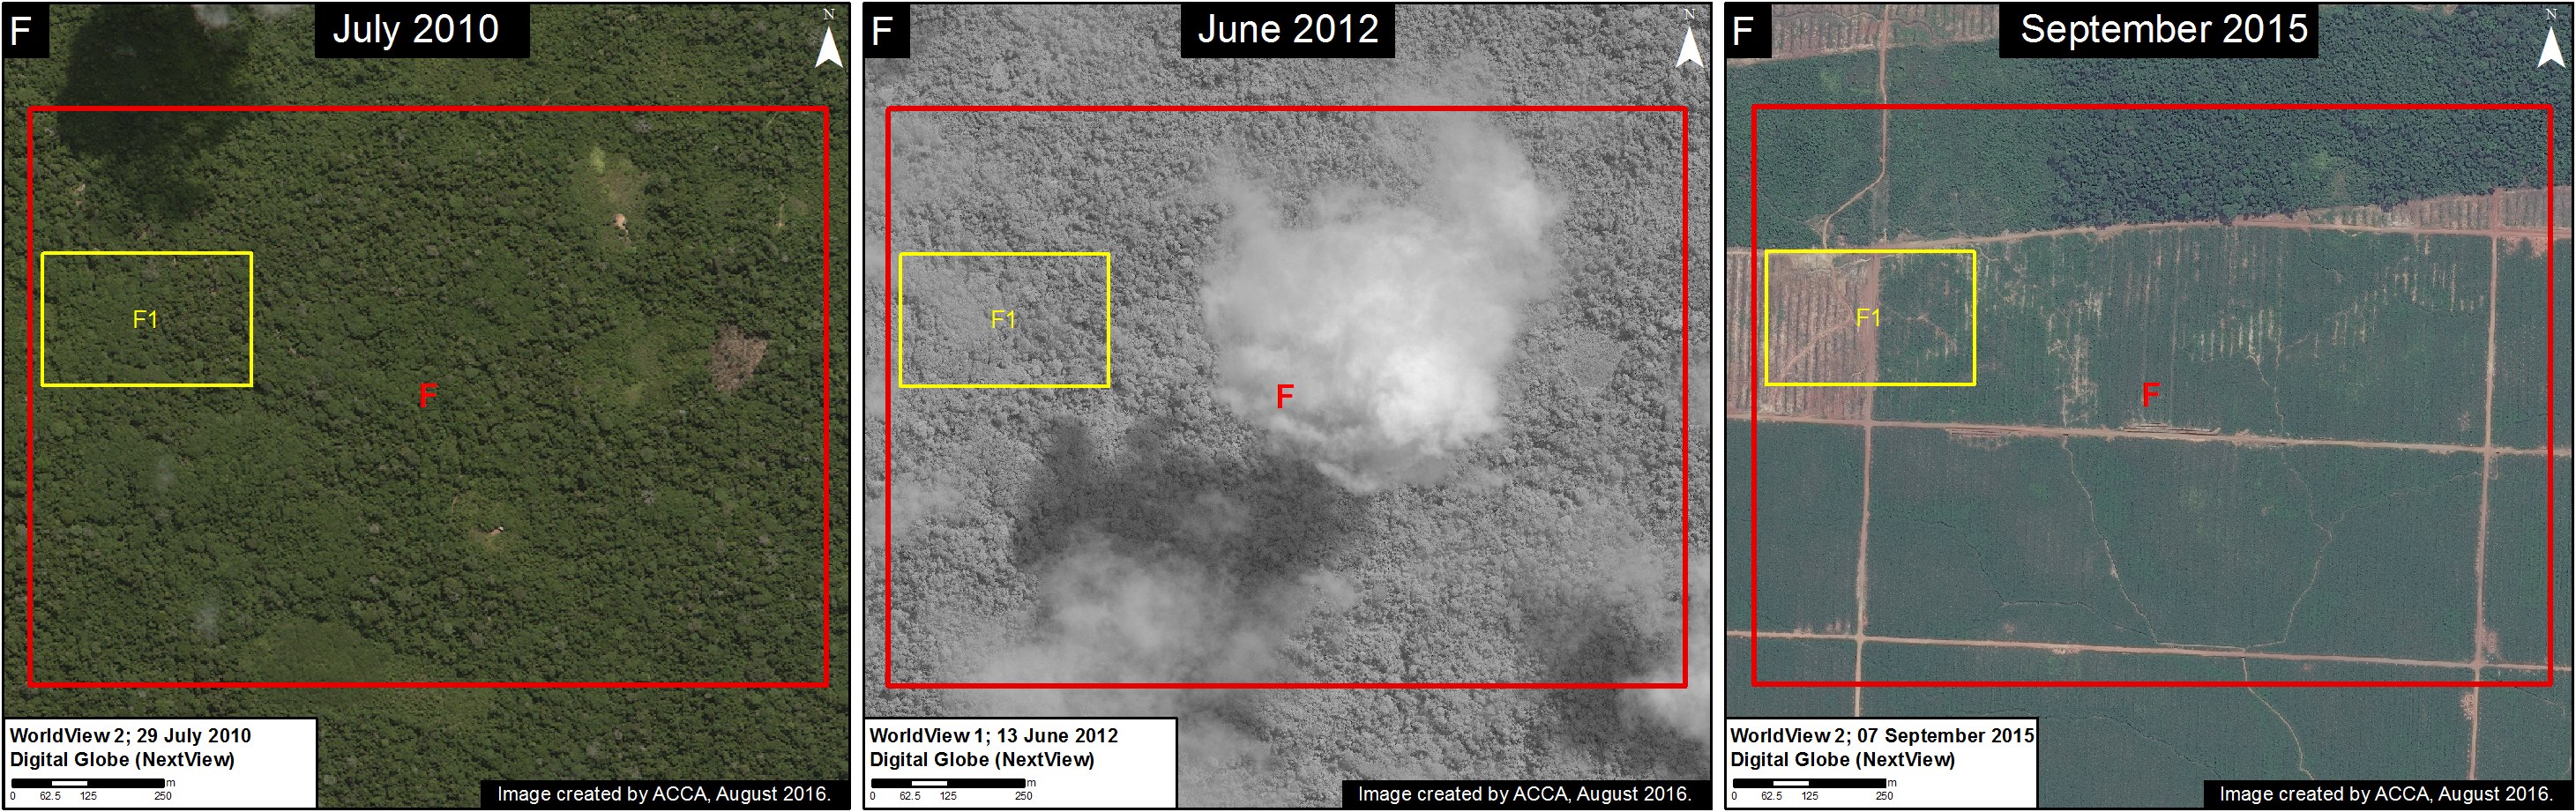
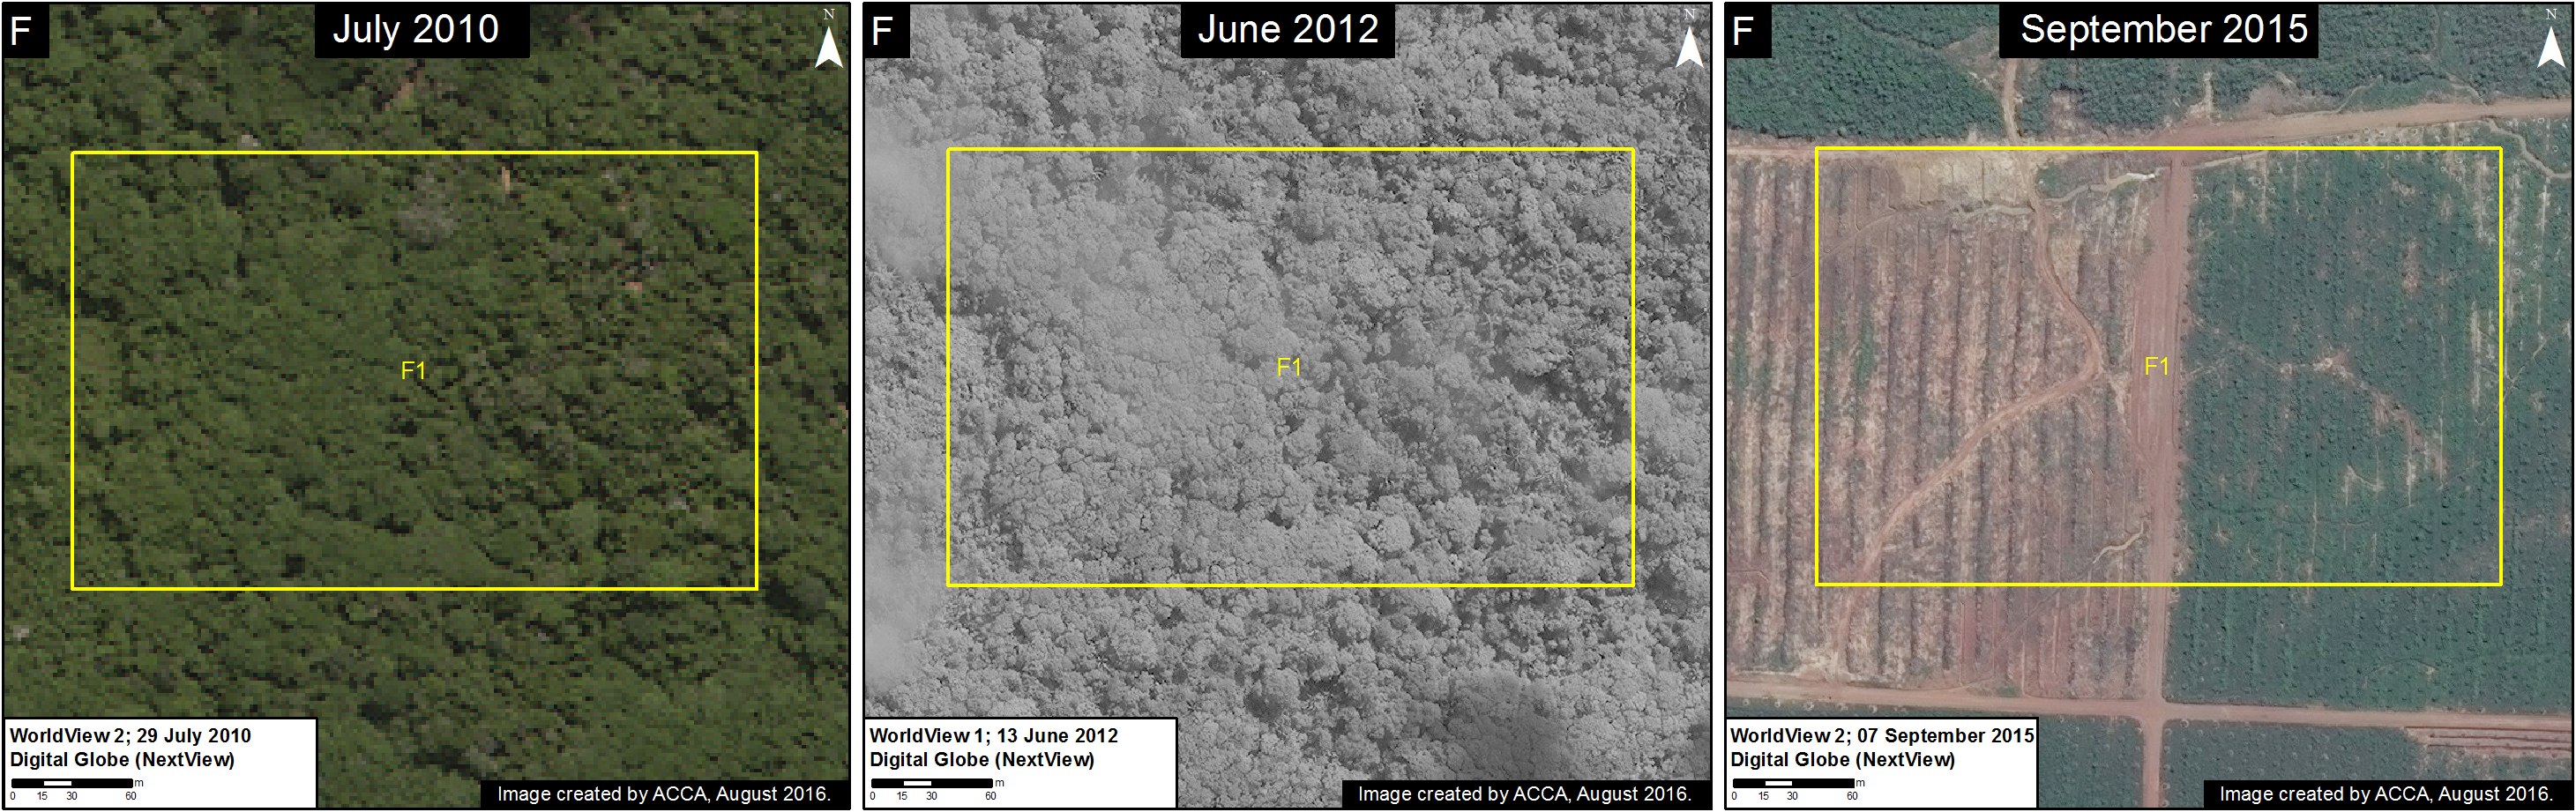
In Images 37e – 37f, we show, in high resolution, two examples of the recent deforestation in this area between June (left panel) and September (right panel) of 2015. See Insets D1 and D2 for context.

Huanuco_D1_v3_DG
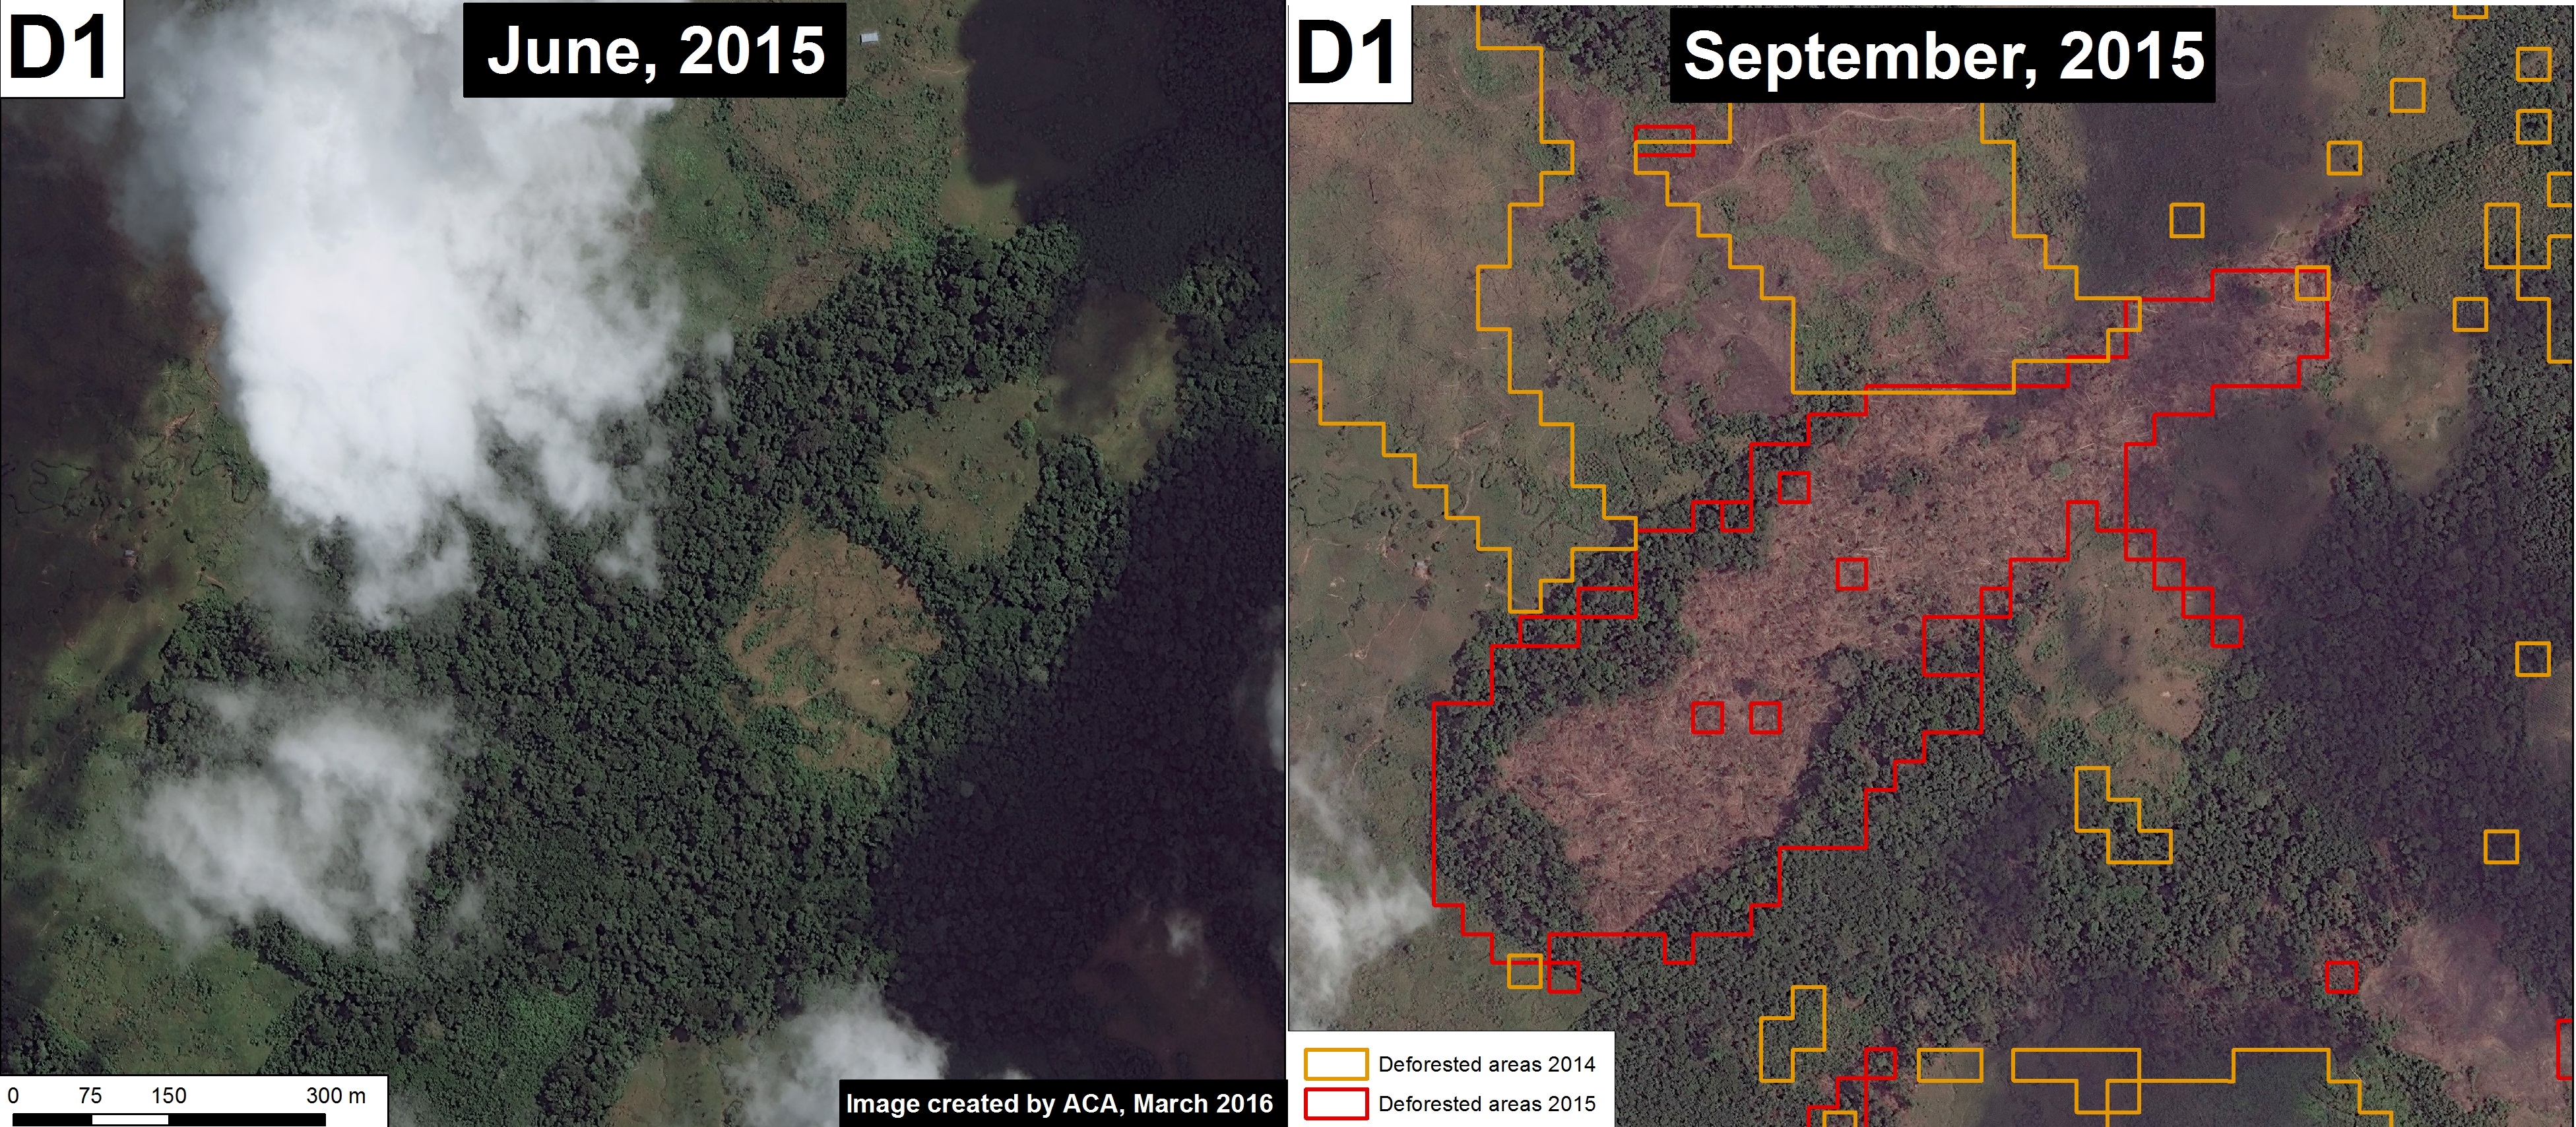
Image 37e. Data: WorldView of Digital Globe (NextView).
Huanuco_D2_v2_DG
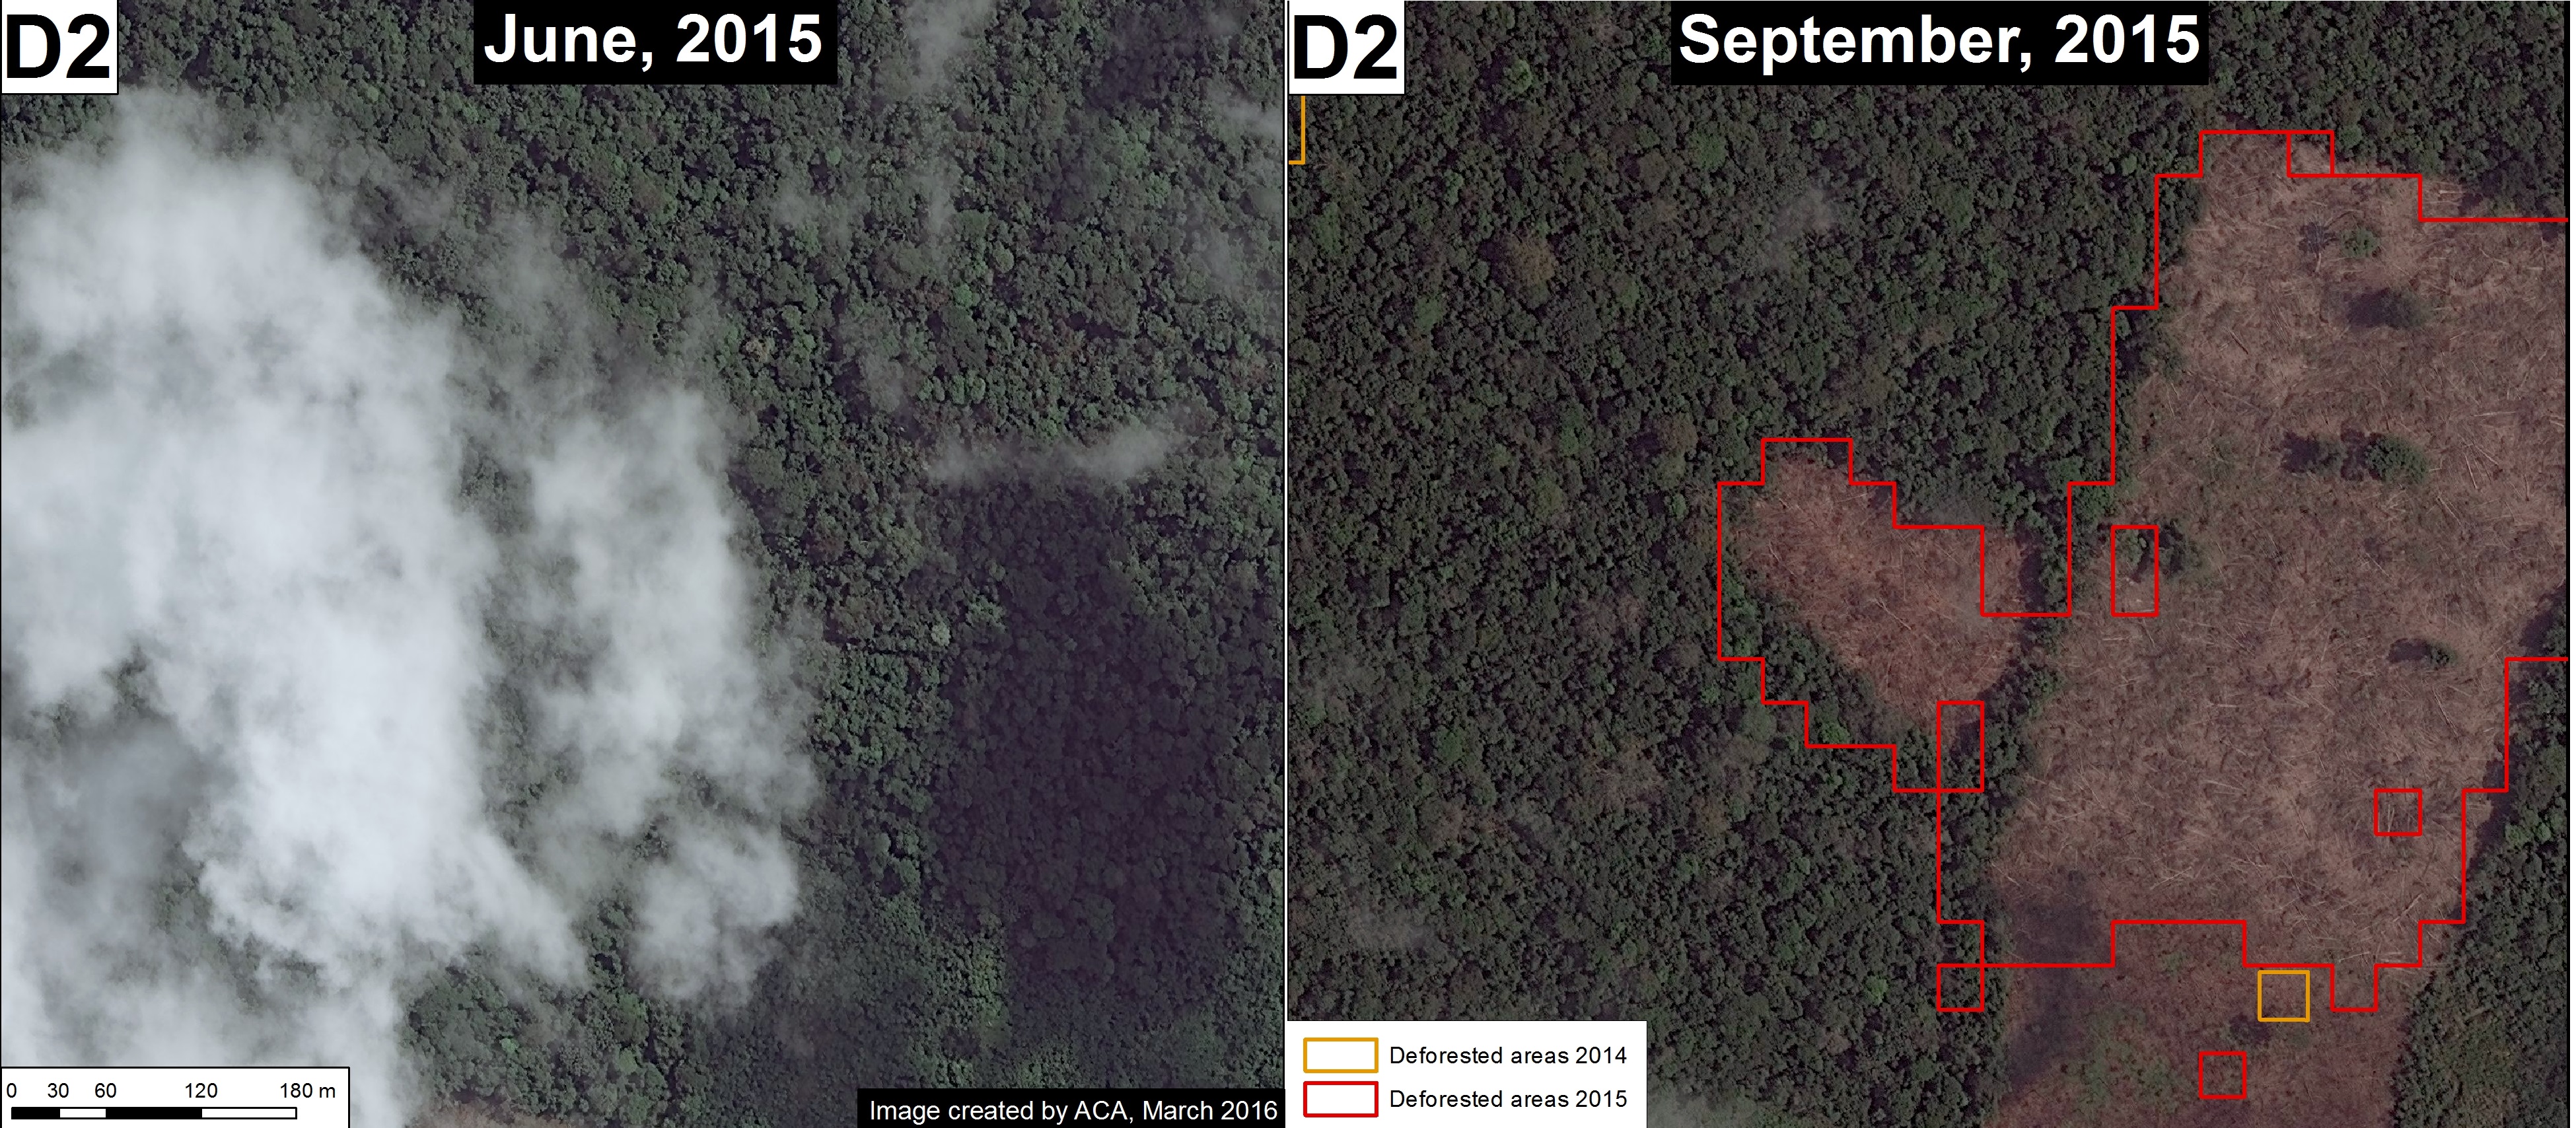
Image 37f. Data: WorldView of Digital Globe (NextView).

References

* Based on the data from the GLAD alerts, produced by the University of Maryland, Google, and Global Forest Watch. http://www.globalforestwatch.org/map/5/-9.31/-75.01/PER/grayscale/umd_as_it_happens

*Hansen, M.C., A. Krylov, A. Tyukavina, P.V. Potapov, S. Turubanova, B. Zutta, S. Ifo, B. Margono, F. Stolle, and R. Moore. Humid tropical forest disturbance alerts using Landsat data. Environ. Res. Lett. 11: 034008.


Citation

Finer M, Novoa S, Cruz C, Peña N (2016) Deforestation Hotspot in the central Peruvian Amazon. MAAP: 37.